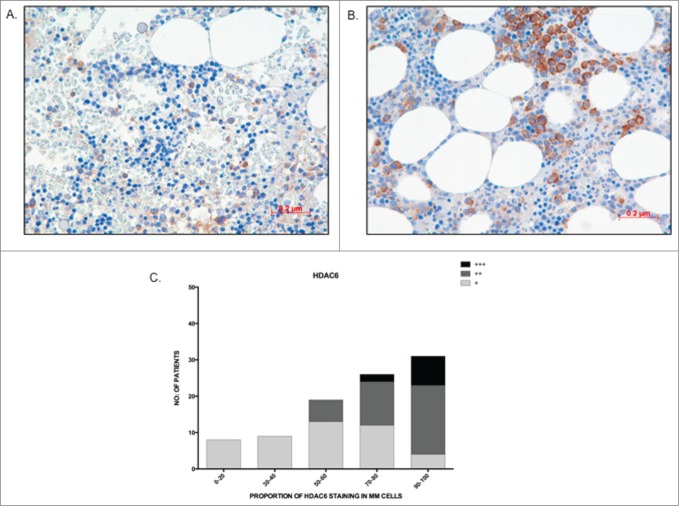
Figure 5.
The majority of patients show high HDAC6 staining in MM cells (A) Image depicting low proportion (30%) and weak staining intensity (+) of HDAC6 in MM cells; (B) Image depicting high proportion (90%) and strong staining intensity of HDAC6 in MM cells; (C) Graph representing the distribution of HDAC6 staining proportion and intensity in bone marrow trephines tested. Higher proportion of HDAC6 staining correlated to stronger staining intensity.

