
Figure 2.
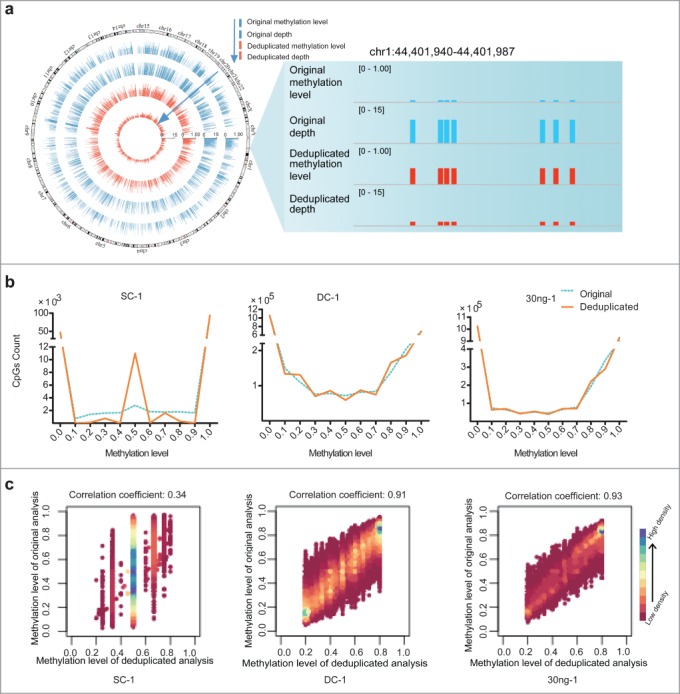
Duplication-induced artifacts in reduced representation bisulfite sequencing (RRBS) data. (A) Deviation of coverage-depth and methylation level between original and deduplicated analysis. In the original and deduplicated analyses, the total original reads and the deduplicated reads were used for subsequent analysis, respectively. The Circos plot on left displays the methylation level and depth of 5,246 CpG sites (differential methylation level > 0.2 between original analysis (blue) and deduplicated analysis (red; coverage ≥ 2). The right plot shows a representative locus (chr1:44,401,940-44,401,987) of significant deviation between the original and deduplicated analysis. (B) Distribution of CpG sites showing different DNA methylation levels in each set of original (blue dotted lines) and deduplicated (orange solid lines) data for the single-cell (SC), dozens-of-cells (DC), and 30 ng of MCF-7 DNA samples. The y-axis shows the number of counts in each range of methylation level. (C) Scatter plots of correlation coefficients between the methylation levels determined by means of deduplicated analysis and original analysis for each sample. We selected CpGs exhibiting methylation level ranging from 20% to 80%, as determined through deduplicated analysis. Horizontal and vertical axes represent the methylation levels of CpGs determined from the deduplicated analysis and original analysis, respectively. Color bars, ranging from pink to blue, represent the increase of CpG density. Correlation coefficients are shown above the scatter plots.