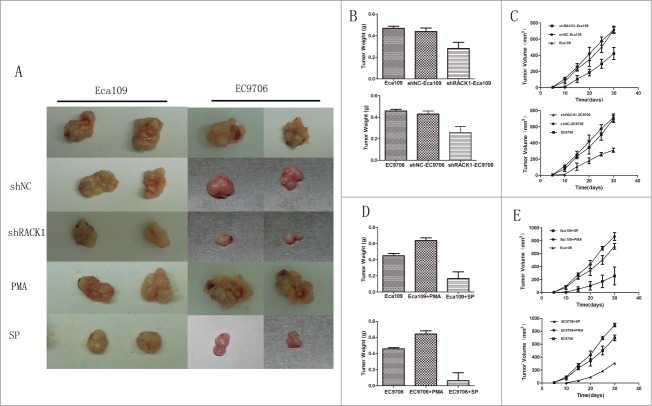
Figure 4.
RACK1 regulated cell proliferation in vivo. Activation of protein kinase C promoted tumor growth in vivo while SP suppressed. (A), Left, representative tumors from Eca109 cells; right, representative tumors from EC9706 cells. (B and C) Down-regulation of RACK1 inhibited tumor growth in vivo. Upper: Eca109; lower: EC9706. B, tumor weight from the down-regulated cells were significantly lower than the negative control group (P = 0.0003, upper; P = 0.0029, lower). (C) Tumor volume from the downregulated cells were significantly lower than the negative control group (P = 0.0119, upper; P = 0.0192, lower). (D and E) PMA promoted tumor growth in vivo while SP suppressed. Upper: Eca109; lower: EC9706. (D) Tumor weight from the PKC activated cells were significantly higher than the negative control group (both P<0.0001); tumor weight from the PKC suppressed cells were significantly lower than the negative control group (P = 0.0001, upper; P = 0.0002, lower). (E) Tumor volume from the activated group were significantly higher than the control group (P = 0.0288, upper; P = 0.0405, lower), while the suppressed group showed reverse effect (P = 0.0308, upper; P = 0.0103, lower).

