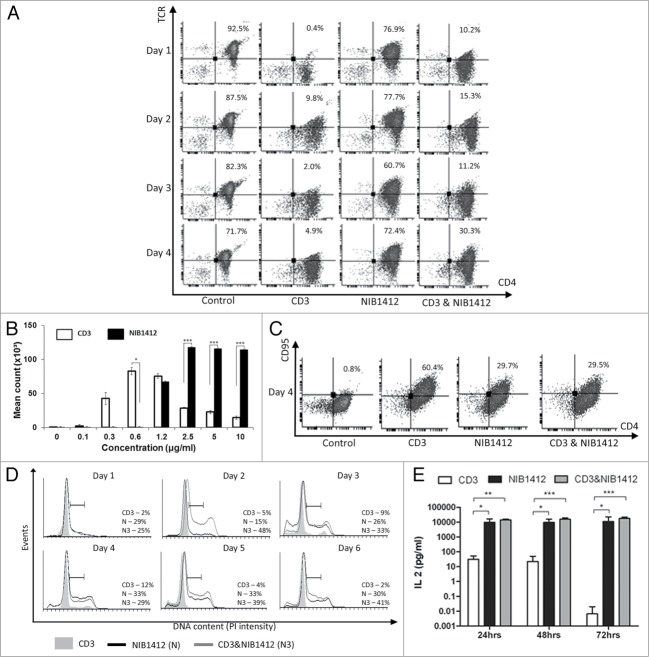
Figure 1.
Dysregulated T cell function induced by CD28SA stimulation. (A) Human CD4+ TEMs were stimulated for 1 to 4 d with plate-bound anti-CD3 mAb (CD3, 5 μg/ml); NIB1412 (NIB1412, 10 μg/ml); anti-CD3 mAb and NIB1412 (CD3 and NIB1412); control category included cells without any treatment (Control). Cells were harvested at indicated time points and stained with fluorochrome-conjugated anti-CD4 and anti-TCR antibodies followed by flow cytometric analysis. Population of CD4+TCR+ cells are shown in the upper right quadrant as percentages of total T cells. Results are representative of four independent experiments. (B) Human CD4+ TEMs cells were stimulated with the indicated concentrations of plate-bound antibodies and proliferation was measured three days post-activation by 3H-labeled thymidine incorporation. The vertical axis represents mean cpm ± SD from triplicate wells. The data are representative of four independent experiments, (*P < 0.05, ***P < 0.001; unpaired t test). (C) Cell surface staining of human CD4+ TEMs stimulated for 4 d with 5 μg/ml of plate-bound anti-CD3 mAb and/or 10 μg/ml of NIB1412. The percentages of the CD4+ CD95+ cells are shown in the upper right quadrant. Results are representative of three independent experiments (D) Human CD4+ TEMs were stimulated for 1 to 6 d, fixed with ice cold 70% ethanol, stained with propidium iodide and cells in S-phase were quantified by flow cytometry. Results are representative of at least four independent experiments. (E) IL-2 concentrations in the supernatants from human CD4+ TEMs stimulated for 24, 48 and 72 h were determined by enzyme-linked immunosorbent assay (ELISA). The IL-2 titers from four independent experiments (mean ± SD of replicate samples) are expressed as picograms per mL on a log10 scale. (*p < 0.05, **p < 0.01, ***p < 0.001; two-way ANOVA).

