
Figure 2.
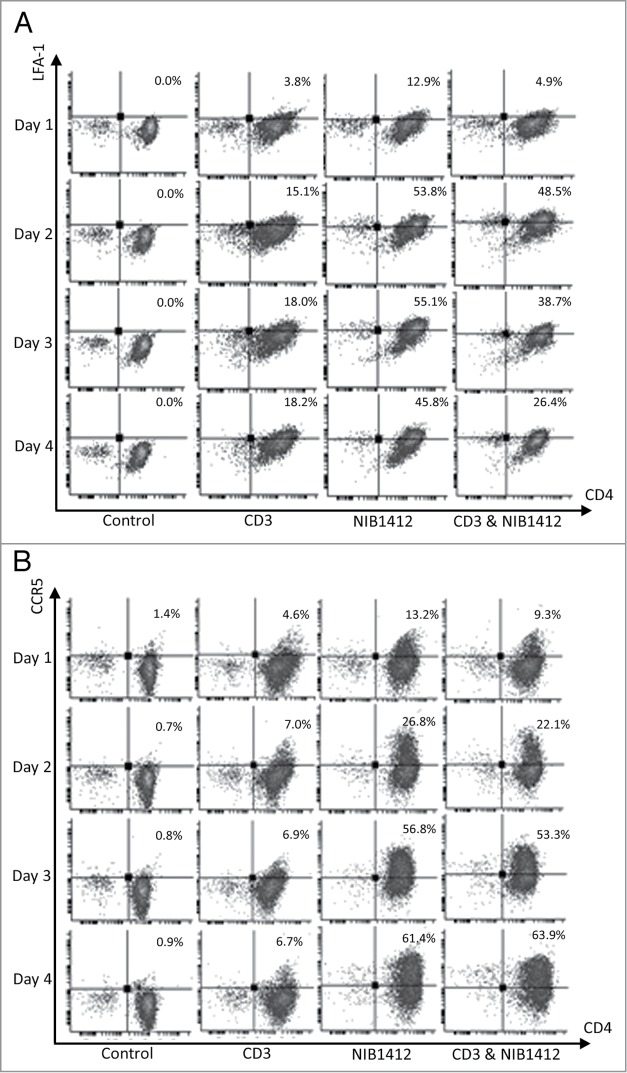
Enhanced cell surface expression of LFA-1 and CCR5 on CD28SA-activated CD4+ effector memory T cells. Human CD4+ TEMs were stimulated for 1 to 4 d with plate-bound anti-CD3 mAb (CD3, 5 μg/ml); NIB1412 (NIB1412, 10 μg/ml); anti-CD3 mAb and NIB1412 (CD3&NIB1412); control category included cells without any treatment (Control). Cells were harvested at indicated time points and stained with fluorochrome-conjugated anti-CD4 and anti-LFA (A) or anti-CD4 and anti-CCR5 (B) antibodies followed by flow cytometric analysis. (A) Population of CD4+LFA+ cells are shown in the upper right quadrant as percentages of total T cells. The cells are shown as percentages of total T cells in the upper right quadrant. (B) Population of CD4+CCR5+ cells are shown in the upper right quadrant as percentages of total T cells. Results are representative of four independent experiments.