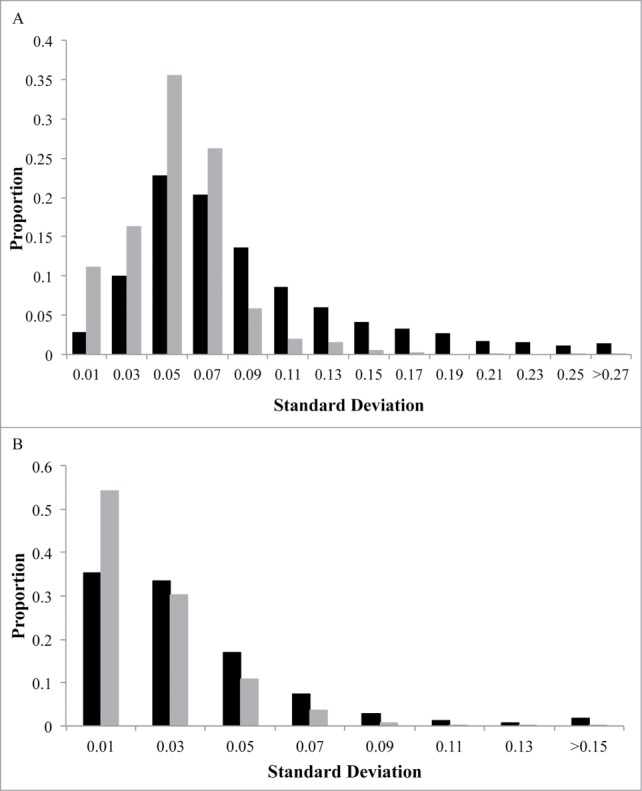
Figure 2.

Distribution of maternal DNA methylation for CpG sites. The x-axis represents the standard deviation (SD) of each CpG site's methylation (β) values in maternal leukocytes. The y-axis indicates the proportion of CpG sites in bins determined by SD. Black represents CpG sites that may be attributed to genetic variation while gray represents CpG sites that cannot be attributed to genetic variation. Graph (A) depicts the distribution of correlated CpG sites (n = 5,171). Graph (B) depicts the distribution of all CpG sites (n = 479,808).
