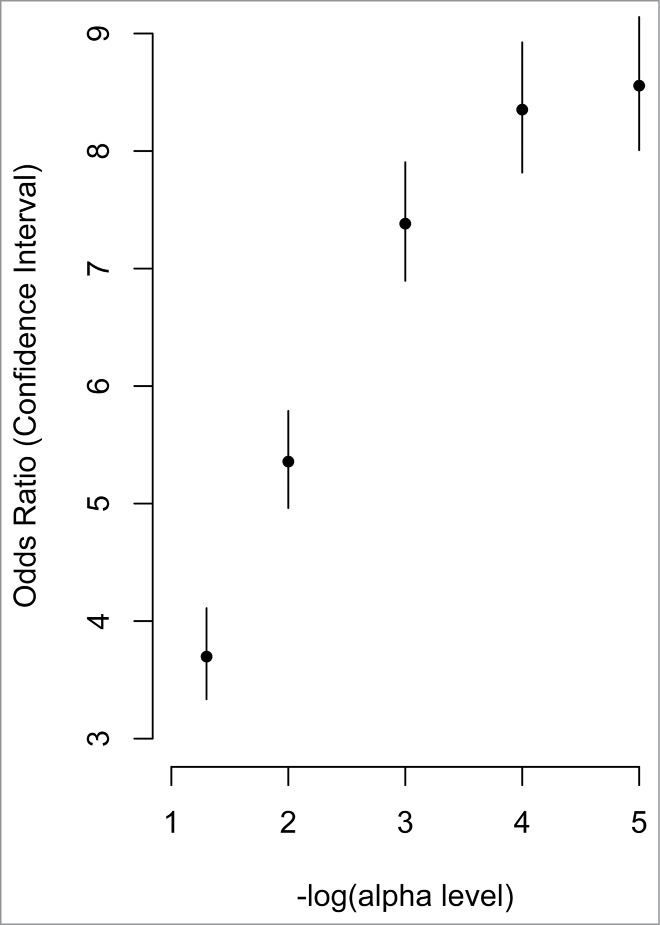
Figure 3.

Correlated CpG sites and their enrichment in meQTLs. The x-axis represents increasing statistical significance of genotype-methylation associations (cis-meQTLs). The –log10 is used to represent the statistical threshold (α level) used to define meQTLs (i.e., 1 is equivalent to P < 0.1, and 2 is equivalent to P < 0.01, etc.). The y-axis represents the odds ratios comparing the probability that a correlated CpG site associates with a genotype (i.e., is an meQTL) with greater likelihood than an uncorrelated CpG site. The vertical lines represent the confidence interval for each odds ratio.
