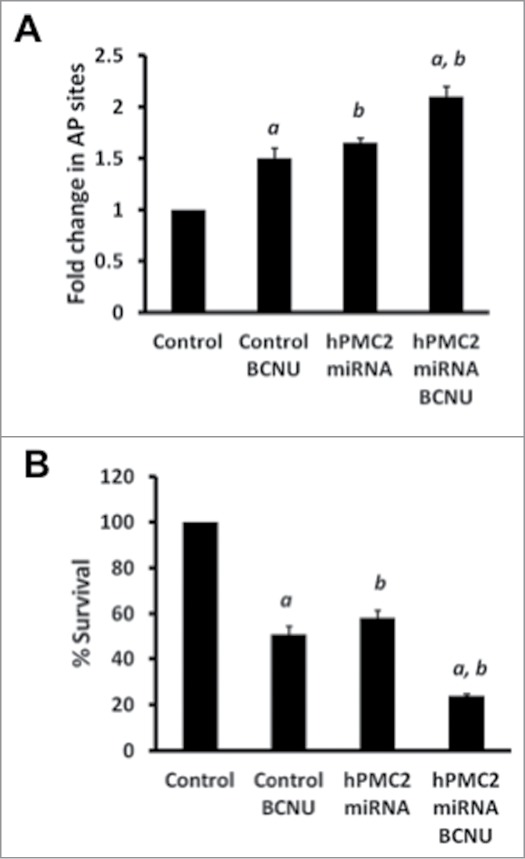
Figure 3.

Enhanced BCNU-induced toxicity in hPMC2 downregulated MDA-MB-231 cells. (A) Control and hPMC2 downregulated MDA-MB-231 cells were either untreated or treated with 50 μM BCNU for 24 hours. Genomic DNA was isolated from cells and a biotinylated ARP was used to detect the abasic sites. Error bars indicate SEM of 2 independent experiments with triplicates for each treatment. a, significance (P < 0.05) vs. untreated cells; b, significance (P < 0.05) vs. control transfected cells with the same treatment. (B) Control and hPMC2 downregulated MDA-MB-231 cells were either untreated or treated with 50 μM BCNU for 48 hours and maintained for a week. MTT assay was performed and the bars represent the fold change in % survival. Error bars indicate SEM of 2 independent experiments with triplicates for each treatment. a, significance (P < 0.05) vs. untreated cells; b, significance (P < 0.05) vs. control transfected cells with the same treatment.
