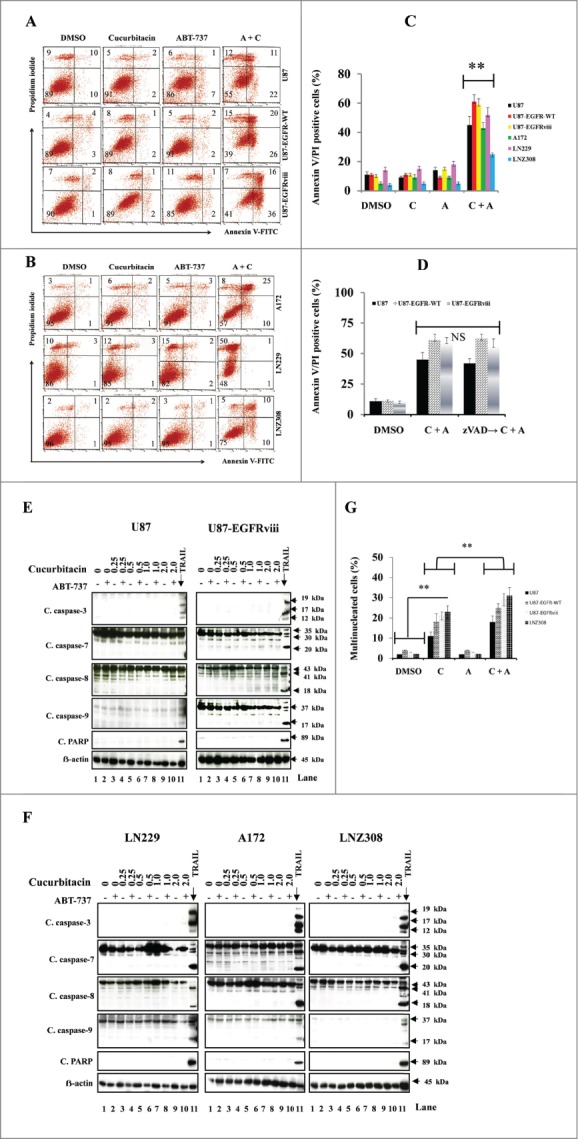
Figure 4.

Cotreatment with cucurbitacin and ABT-737 potentiates glioma cell death in a caspase-independent manner. EGFR overexpressing human glioma cell lines U87-EGFR-WT, U87-EGFRviii and isogenic control, U87 (A), A172, LN229 and LNZ308 (B) were seeded at 60% confluence, allowed to attach overnight, and treated with cucurbitacin (C) or ABT-737 (A) or the combination of both (C + A) for 24 h. Control cells received an equivalent amount of DMSO. Apoptosis was analyzed by flow cytometry. The percentages of cells in each quadrant are indicated. (C) Bar chart represents data from 3 independent experiments (** P < 0.005 vs. untreated control or single agent). (D) U87, U87-EGFR-WT and U87-EGFRviii cells were pretreated with pan-caspase inhibitor zVAD-fmk (25 μmol/L) for 2 h followed by combination of cucurbitacin plus ABT-737 (C + A) for 24 h. Cell death was analyzed by flow cytometry. Data are representative of triplicate studies from 3 independent experiments (NS, not significant). U87 and U87-EGFRviii (E) LN229, A172 and LNZ308 (F) were seeded at 60% confluence, allowed to attach overnight, and treated with cucurbitacin (indicated concentration) with or without ABT-737 (500 nmol/L) for 24 h. Control cells received an equivalent amount of DMSO. Cell extracts were subjected to Western blot analysis with indicated antibody. LN18 treated with TRAIL (25 ng/ml for 3 h) served as positive control. G. U87, U87-EGFR-WT, U87-EGFRviii and LNZ308 cells were grown on chamber slides in growth medium, and, after an overnight attachment period, were exposed to cucurbitacin (C, 100 nmol/L) or ABT-737 (A, 1.0 μmol/L) or the combination of both (C + A) or vehicle (DMSO) for 72 h. Cells were washed once with PBS, fixed with 3.7% formaldehyde for 30 min and stained with DAPI for 2 h at room temperature. The slides were then washed in PBS, mounted, and examined under a fluorescent microscope. Cells with multi-lobed nuclei are presented in the bar graph. Points represent the mean of 3 measurements ± S.D (**, P < 0.005).
