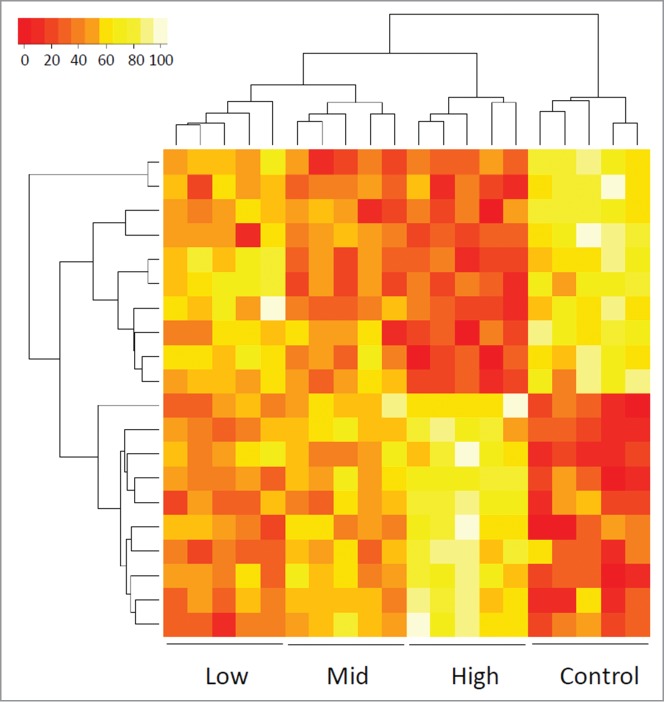
Figure 1.

Heat map showing the methylation values of CHARM probes that differentiate among control and 3 cytogenetic risk groups of AML patients based on unsupervised agglomerative hierarchical clustering. Each column represents a patient. Each row denotes a probe. The top 20 probes are displayed as an example to show how the samples can be classified into 4 distinct groups, normal control, low-risk, mid-risk, and high-risk AML, based on the methylation values (Agglomerative Coefficient = 0.77).
