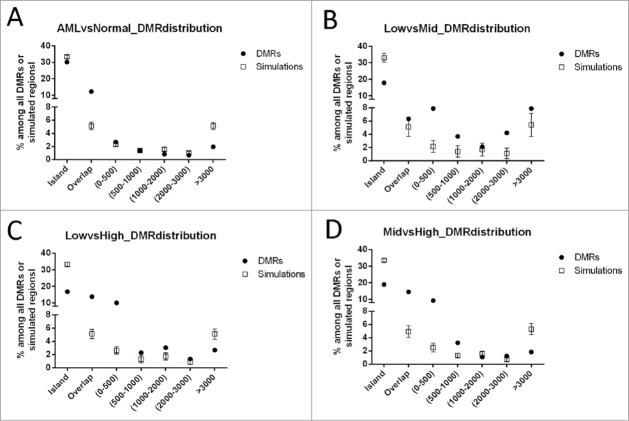
Figure 3.
Distribution of DMRs identified in pair-wise CHARM analyses in relation to CpG islands (CGI). (A) AML vs. Normal; (B) low- vs. mid-risk AML; (C) low- vs. high-risk AML; and (D) mid- vs. high-risk AML. As denoted on the X axis, DMR positions are defined as “islands” (cover or overlap more than 50% of a CGI), “overlap” (0.1–50% of a CGI), or located 0–500 bp, 500–1000 bp, 1000–2000 bp, 2000–3000 bp, or greater than 3000 bp from the nearest CGI. The percentage of each group is presented for the DMRs of interest (filled circles). The empty squares present the null distribution (Mean±STD), calculated by repeated (100 times) simulation using genomic fragments randomly selected among CpG regions targeted by the array.

