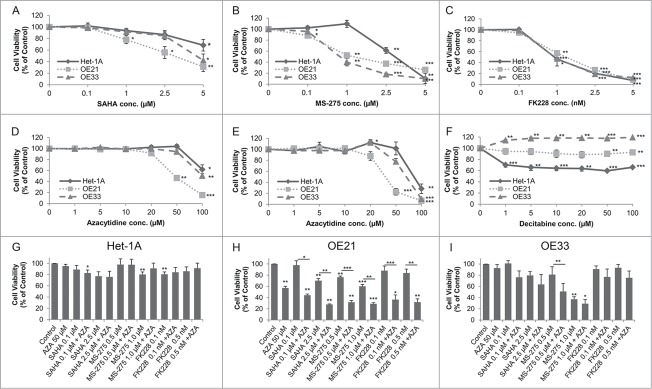
Figure 3.

Dose response curves for the effect of HDACi/AZA on cell viability. Cells were cultured with DMSO (=0 on x-axis) and various doses of (A) SAHA, (B) MS-275, (C) FK228 as well as (D, E) AZA or (F) DAC for 72 h before cell viability was analyzed. To rule out known difficulties with AZA drug stability, cells were treated with (D) continuous AZA or (E) daily refreshment of AZA. (G-I) Cells were treated with 50 μM AZA and 2 different concentrations of each HDACi for 72 h before cell viability was determined. Data is represented as percent in comparison to vehicle (DMSO) treated cells (set to 100%). Shown is the mean ± SEM for 3 independent experiments, each performed in technical triplicate. Significance levels are represented as *: 0.05–0.01, **: ≤ 0.01–0.001 and ***: ≤ 0.001.
