Figure 7.

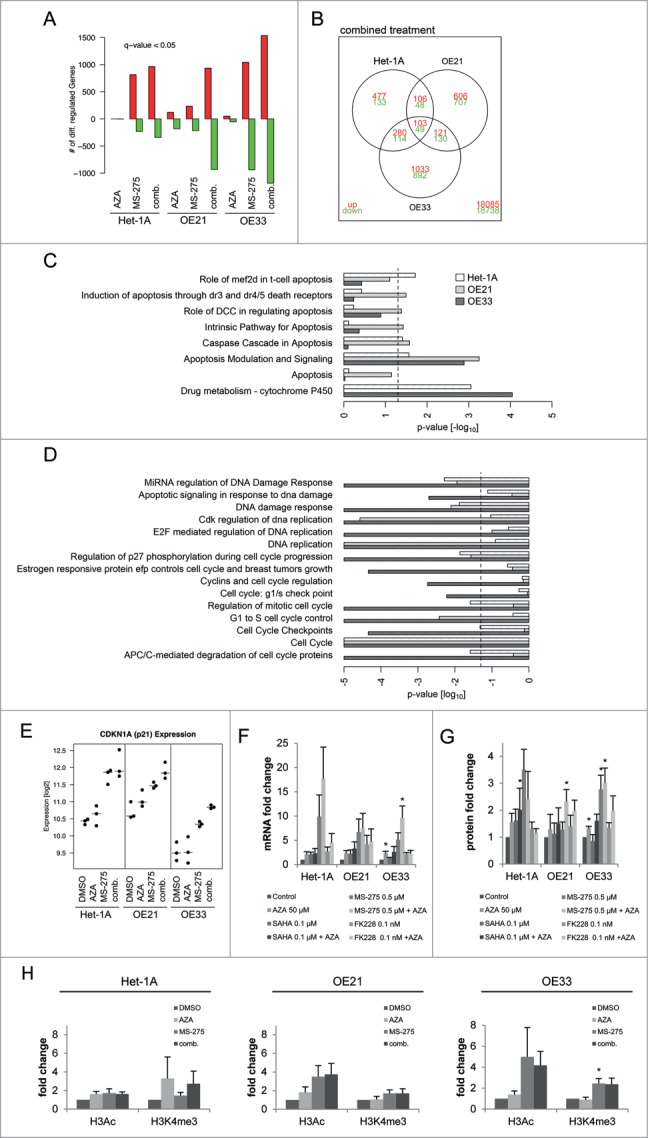
RNA transcriptome analyses reveal differentially regulated genes by MS-275/AZA treatment. (A) The diagram represents the absolute numbers of significantly upregulated (red bars) and downregulated (green bars) genes for MS-275, AZA and their combination (comb.) compared to vehicle (DMSO) treated cells. (B) Number of genes regulated by MS-275/AZA treatment depicted by Venn diagram, showing joint or unique regulation between cell lines. Using the curated gene sets from the Consensus Path DB,80 all gene sets related to apoptosis, drug metabolism, DNA replication and damage as well as cell cycle were extracted, depicting (C) upregulated and (D) downregulated gene sets from OE21, OE33 and Het-1A cell lines. (E) Regulation of CDKN1A/p21 mRNA in the present RNA transcriptome were confirmed (F) by qRT-PCR on mRNA and (G) by immunoblot on protein level for all 3 HDACi/AZA combinations. (H) ChIP analysis was performed 24 h post MS-275/AZA treatment with H3Ac and H3K4me3 followed by real-time PCR of the CDKN1A promotor. Data are represented as fold change of % input DNA (after normalization to H3) compared to vehicle (DMSO) treated cells (mean ± SEM).
