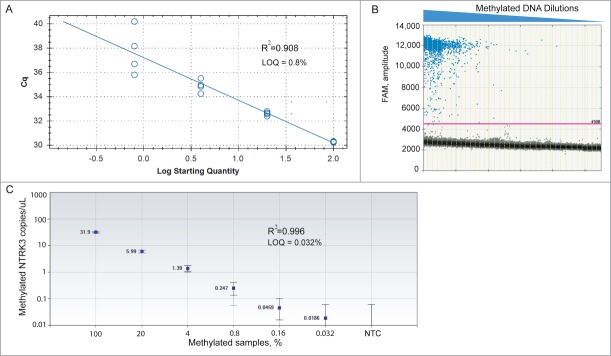
Figure 1.

Comparative analysis of limit of quantification (LOQ) for NTRK3 MethyLight ddPCR and conventional MethyLight PCR. We prepared a 5-fold dilution series of EpiTect 100% methylated control DNA into EpiTect 100% Unmethylated control DNA (total 20 ng of DNA per well). (A) Standard curve of quantification in conventional MethyLight PCR shows relationship between Cq value and log transformation of percentage of methylation. LOQ = 0.8%. (B) 1-D ddPCR analysis plot shows detection of methylated NTRK3 in serial dilutions of mixed samples. Each sample was partitioned into an average of 15,000 droplets per well and replicated in 4 wells. The droplet counts (positive and negative) from all replicated wells were combined to yield a ‘merged’ well. An event with fluorescence amplitude value > 4500 was considered a methylation-positive event (threshold line was set at 4500). The number of methylation-positive events decreased as the methylated DNA was further diluted with unmethylated DNA. (C) ddPCR can detect levels of methylated NTRK3 in mixed samples as low as 0.032%. The concentration and Poisson confidence intervals for each ‘merged’ well were computed using the QuantaSoft software version 1.4.0.99 (BioRad, Hercules, CA). Concentrations represent the average measurement of methylated NTRK3 copies per μL of PCR mixture in merged wells for each sample. Error bars indicate the Poisson 95% confidence intervals for each measurement. R2= 0.996 shows good linear correlation between measured concentration of methylated NTRK3 and expected percentage of methylation. NTC: no-template control.
