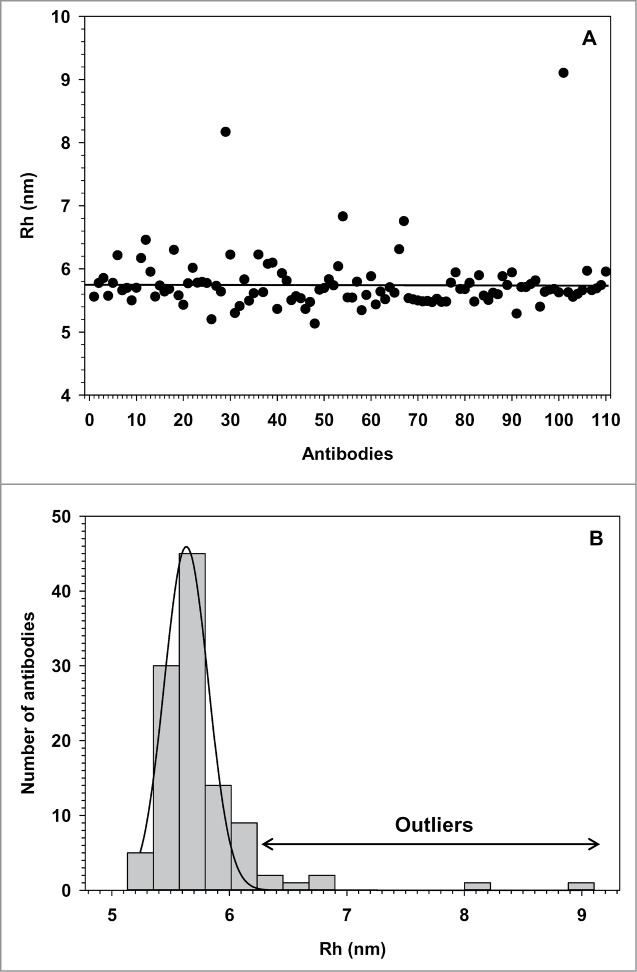
Figure 3.

Rh distribution of a random panel of 110 mAbs. (A) Scatter plot representation of the Rh vs. mAb. The black line corresponds to the average Rh of 5.77 nm. (B) Frequency histogram of the Rh measured at 1.5 mg/ml in PBS. The black line represents the normality fitting.
