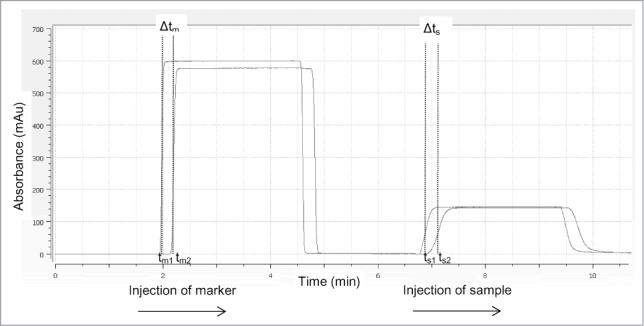
Figure 7.

Protein viscosity measured by the ActiPix/Viscosizer system. Example of a UV chromatogram during viscosity measurement. A dilute solution of the tyrosine marker is continuously injected into the pre equilibrated capillary for 2 min. The Δtm (tm2-tm1) is determined by passage through the dual window of the APS detector. The capillary is then re-equilibrated and the Δts (ts2 –ts1) is measured by injection of the protein sample into the capillary.
