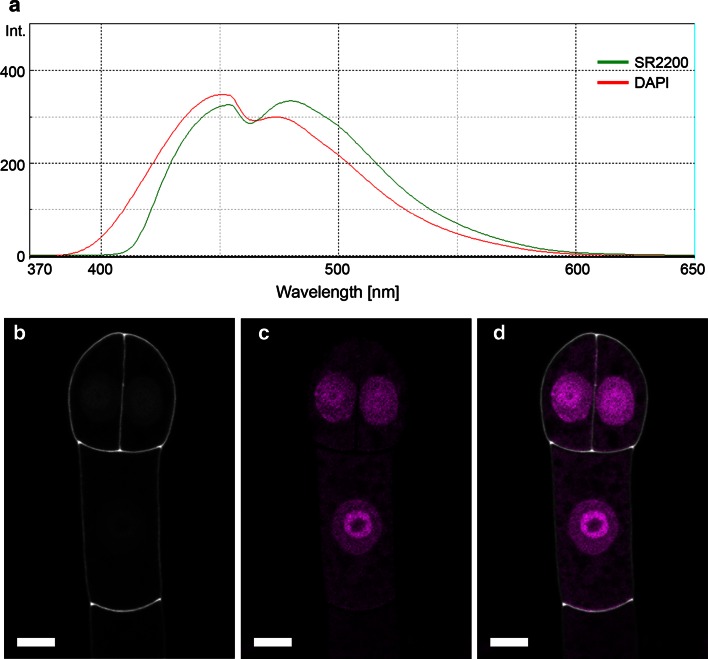
Fig. 3.
Spectral unmixing of SR2200 and DAPI fluorescence signals. a Emission spectra of SR2200 (green line) and DAPI (red line) between 370 and 650 nm (excitation with 350 nm). Both dyes show rather similar emission spectra that can be successfully distinguished and separated in different image channels by spectral unmixing (b–d); SR2200 signal (gray scale) in b, DAPI signal (magenta) in c; merged image in d. Scale bar 5 µm

