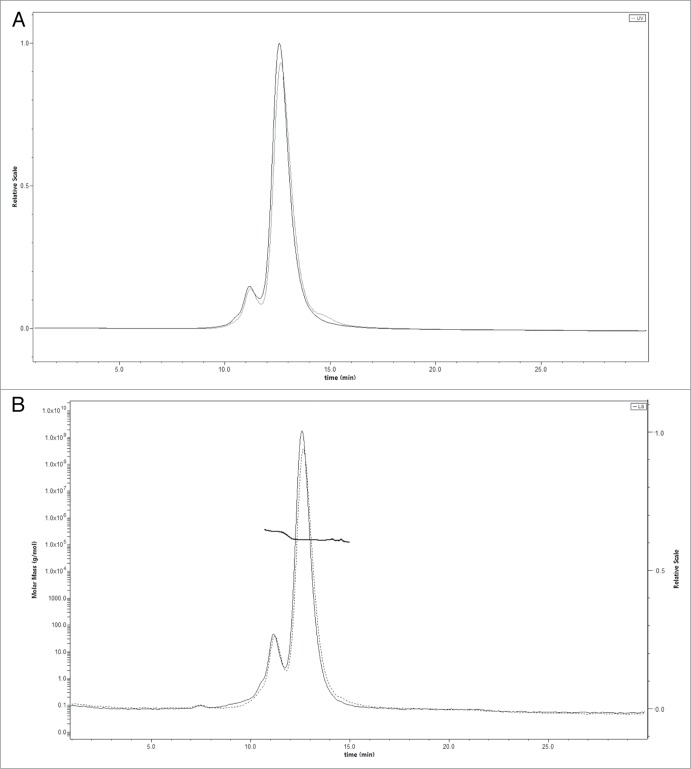
Figure 2.
A and 2B. Size exclusion chromatography of a 10 mg/ml antibody solution in PBS before (solid line) and after (dotted line) nebulization with the Aerogen Solo. (A) UV signal; (B) MALLS signal. The left is Molecular Weight determined by MALLS and the right axis is light scatter in arbitrary units.

