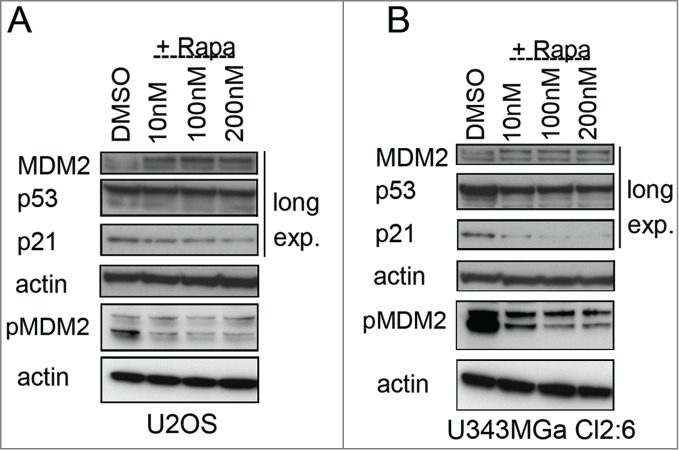
Figure 8.

Altered levels of total and phosphorylated MDM2 in rapamycin treated cells. (A) Levels of MDM2, p-Ser166 MDM2, p53, and p21 proteins in U2OS cells exposed to rapamycin (10 nM – 200 nM) for 18 hours. (B) MDM2, p-Ser166 MDM2, p53, and p21 protein levels in U343MGa Cl2:6 cells exposed to rapamycin (10 nM – 200 nM) for 18 hours (long exp., = long exposure). Total and p-Ser166 MDM2 levels were monitored on 2 different blots but using the same cell lysates.
