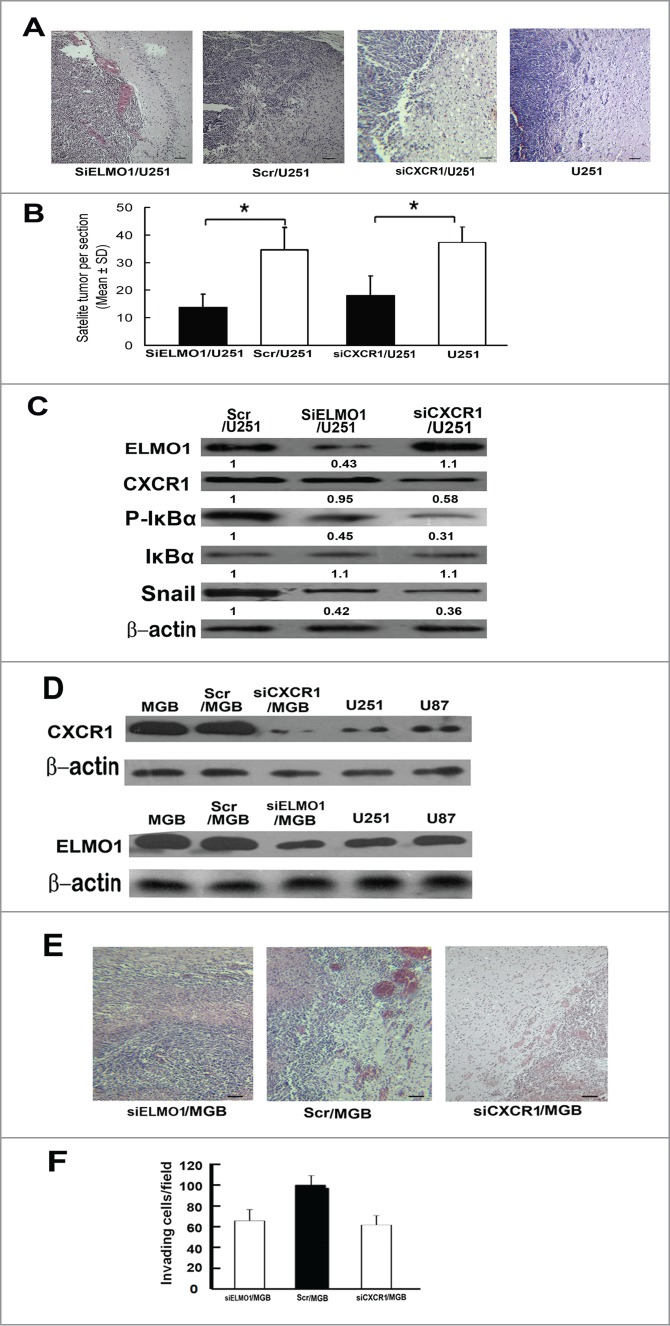
Figure 7.

Reduction of ELMO1 or CXCR1 inhibited U251 cells invasion in vivo. (A) Representative microscope graphs showing less satellite tumors in SiELMO1/U251 or SiCXCR1/U251 injected mice brain tissues than that of Scr/U251 or U251 injected mice brain tissues, Scale bar: 50 um. (B) The number of satellite tumors (tumor foci not connected to main body of tumor) were counted in sections from nude mice sacrificed at day 21 of the study (n = 10 for all group, *P < 0.05, 2-tailed unpaired t-test). (C) Western blot analysis of expression levels of ELMO1, CXCR1, P-IκBα, IκBα and Snail in SiELMO1/U251, Scr/U251 and SiCXCR1/U251 implanted tumor tissues. β-actin was used as a loading control. Quantification of relative protein levels is shown below the blots. Data were collected from a representative of at least 3 independent experiments. (D) Western blot analysis of CXCR1 expression levels in GBM, Scr/GBM, siCXCR1/GBM, U251 and U87 cells(above). Western blot analysis of ELMO1 expression levels in GBM, Scr/GBM, siELMO1/GBM, U251 and U87 cells (under). β-actin was used as a loading control. Quantification of relative protein levels is shown below the blots. Data were collected from a representative of at least 3 independent experiments. (E) Representative microscope graphs showing less satellite tumors in siELMO1/GBM or siCXCR1/GBM injected mice brain tissues than that of Scr/GBM injected mice brain tissues, Scale bar: 50 um. (F) The number of satellite tumors (tumor foci not connected to main body of tumor) were counted in sections from nude mice sacrificed at day 21 of the study (n = 10 for all group, *P < 0.05, 2-tailed unpaired t-test).
