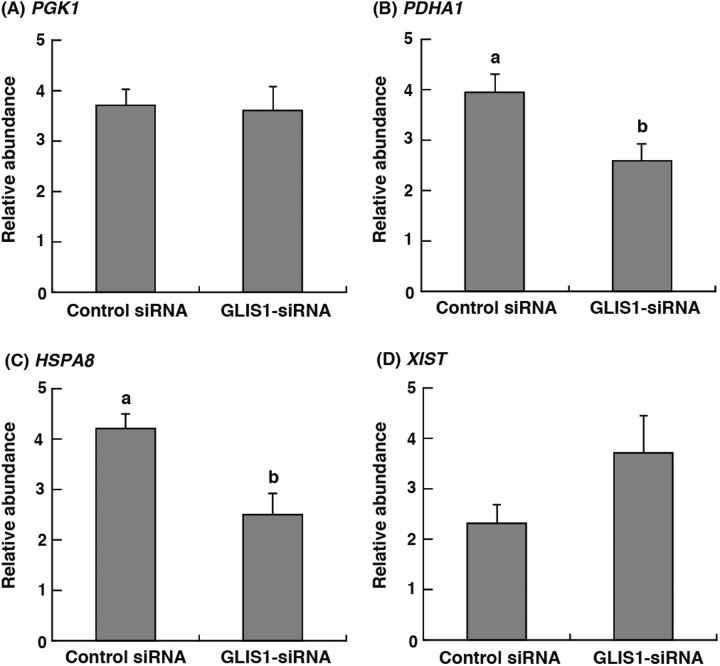
Fig. 3.
Relative abundance (mean ± SEM) of (A) PGK1, (B) PDHA1, (C) HSPA8 and (D) XIST transcripts in bovine 8- to 16-cell stage embryos obtained from Control siRNA or GLIS1-siRNA injection (n = 6). The relative abundance represents the normalized quantity compared with Histone H2A. a, b Different superscripts indicate a significant difference (P < 0.05).

