
Fig. 2.
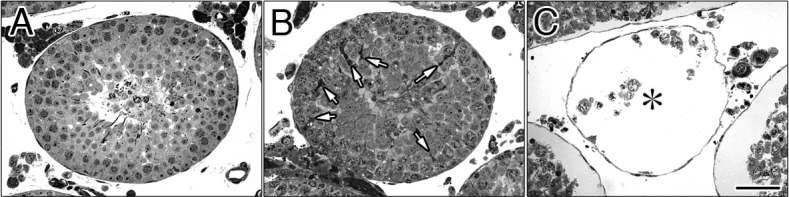
Semithin sections of the seminiferous tubules in EI testes. At 0 min (A; control sample), at 180 min (B), and at 300 min (C) after the EI procedure. Normal spermatogenesis was observed in the control (A) and EI-180 testes (B). The white arrows in B indicate the regions densely stained with TB in the seminiferous epithelium. No evidence of spermatogenesis was observed in the seminiferous tubules in EI-300 testes (C, asterisk). Scale bar, 50 μm.