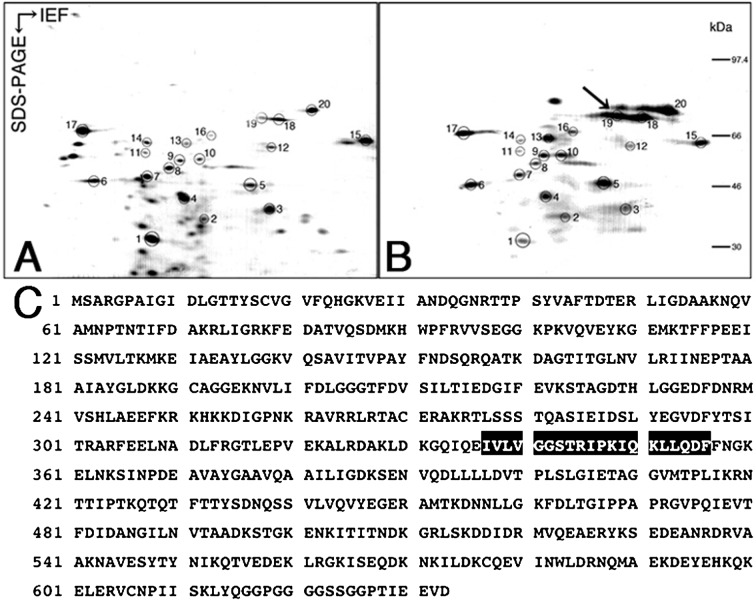
Fig. 6.
Proteome analysis of the EI testes. Two-dimensional mapping of testis proteins in the control (A) and EI-180 testes (B). Full-length amino acid sequence of mouse HSP72 (C). Spots expressed in both testes are indicated by circles and are numbered. The most significant upregulation was observed in spot 19 (B, arrow). The matching amino acid residues are highlighted in black (C).

