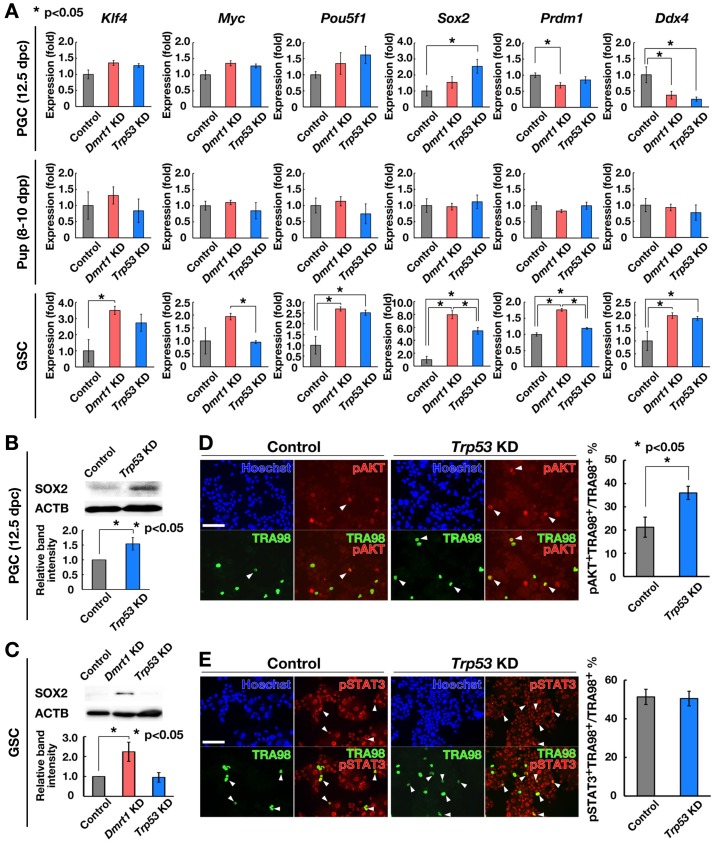
Fig. 2.
Phenotypic changes induced by Trp53 KD. (A) Real-time PCR analysis of PSC and germ cell markers after KD of the indicated genes. Cells were recovered 2 days after KD (n = 5). Results of five experiments. (B) Western blot analysis of SOX2 in PGCs from 12.5 dpc embryos after Trp53 KD (n = 4). Cells were collected 2 days after KD. (C) Western blot analysis of SOX2 in GSCs after Dmrt1 or Trp53 KD (n = 4). Cells were collected 2 days after KD. (D, E) Double immunostaining of PGCs from 12.5 dpc embryos with antibodies against pAKT (D; n = 4) or pSTAT3 (E; n = 4) 2 days after Trp53 KD. TRA98 was also used to detect PGCs. At least 100 cells were counted for each sample. Results of four experiments. Bar = 100 μm (D, E). Stain: Hoechst 33342 (D, E).

