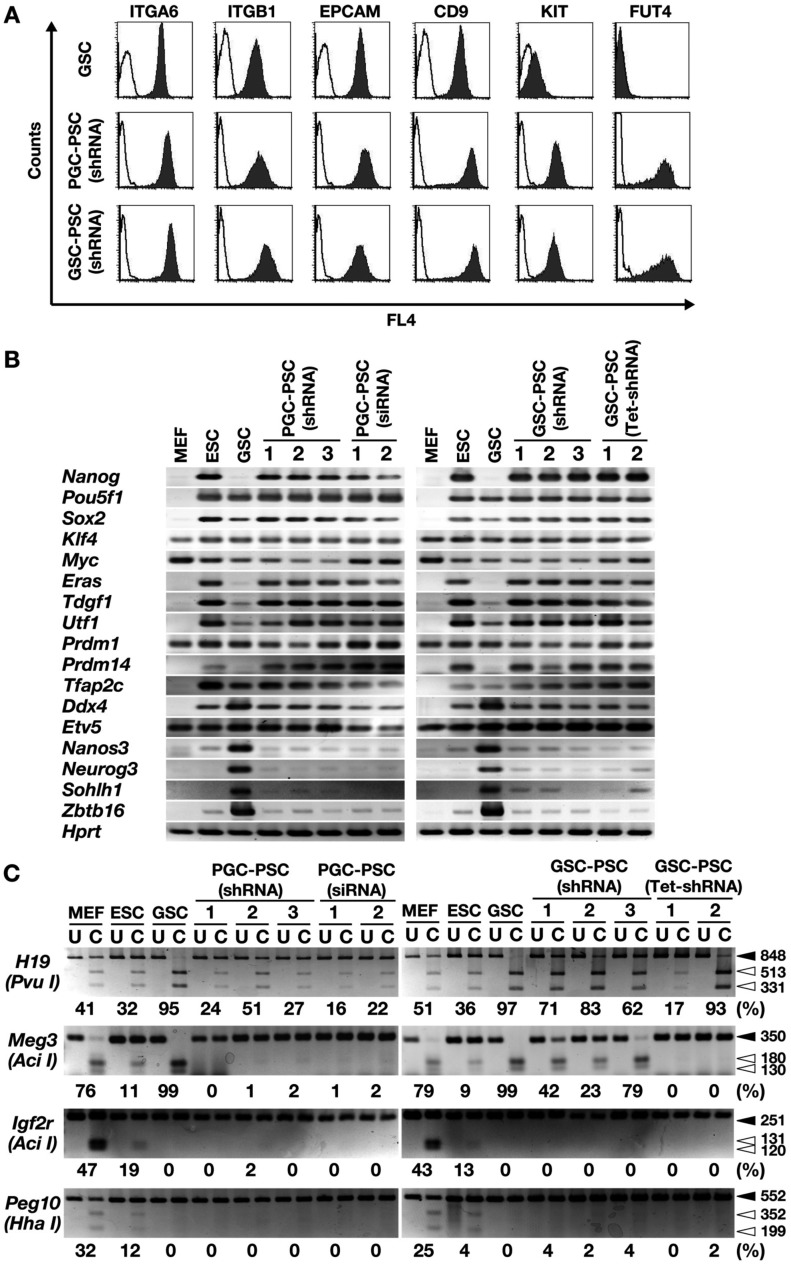
Fig. 3.
Phenotypic characterization of PSCs derived from PGCs and GSCs. (A) Flow cytometric analysis of cell surface markers. Open histograms indicate controls. (B) RT-PCR analysis. (C) COBRA of imprinted genes. Open arrowheads, methylated DNA; closed arrowheads, unmethylated DNA. Enzymes used to cleave each locus are indicated in parentheses. Levels of percentage methylation, estimated based on the intensity of each band, are indicated below the gels. U, uncleaved; C, cleaved.

