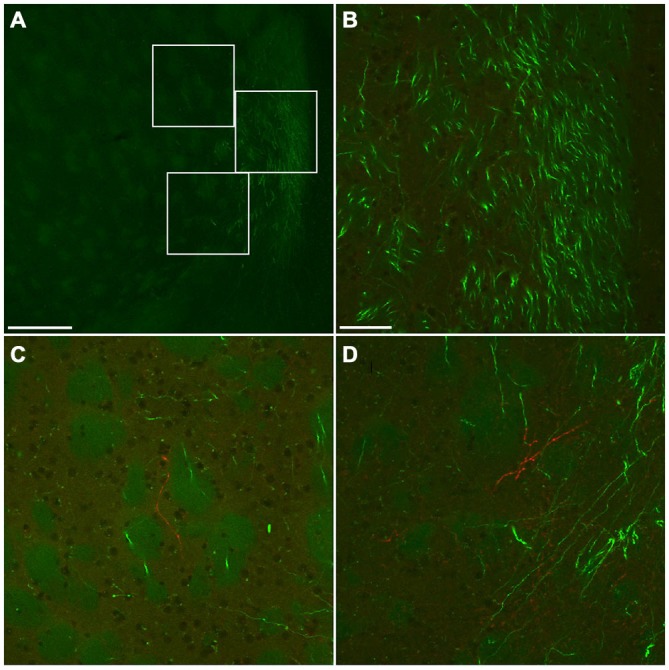
Figure 10.

Fluorescent photomicrographs showing the distributions of GFP- or mCherry-immunoreactive fibers in the ventromedial part of CPu. Low (A) and high (B–D) magnification confocal laser scanning images showing mCherry- or GFP-immunoreactive fibers after the injection of AAV-Ef1a-DIO-hChR2-mCherry and AAV-CAG-GFP into the frontal cortex. No mCherry-immunoreactive fiber was found in the main trajectory of GFP-immunoreactive fibers (B). In contrast, some mCherry-immunoreactive fibers were found in the marginal zone of main trajectory of GFP-immunoreactive fibers (C,D). The upper, middle, bottom rectangles in (A) correspond with (C), (B), and (D), respectively. Scale bars = 250 μm in (A); 50 μm in (B) (for C,D).
