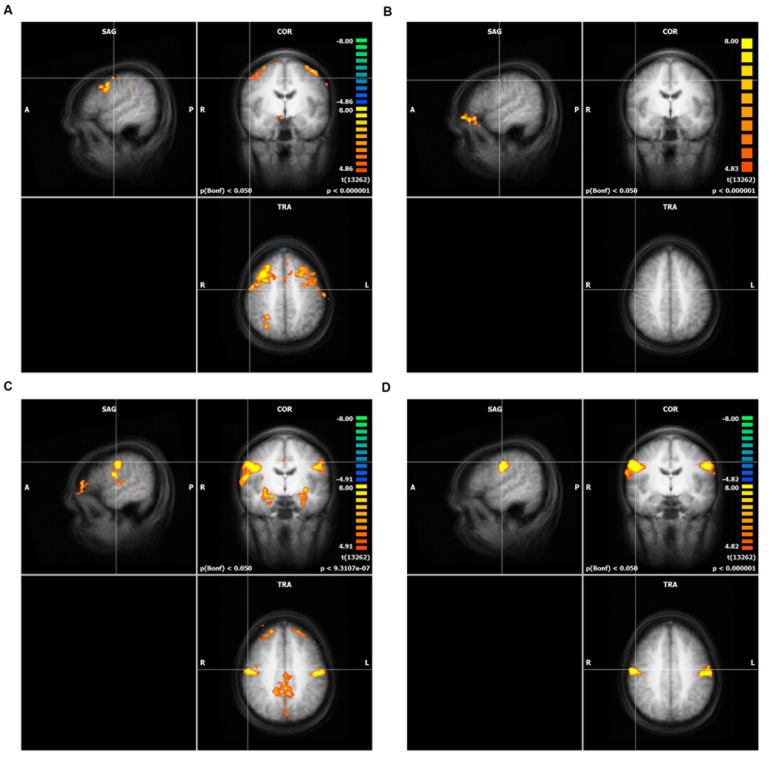
FIGURE 1.
Result of the whole brain analysis of direct mapping for each action unit (AU), (A) AU1+2, (B) AU4, (C) AU12, (D) AU24. The crosshair in each of the four panels is located at the peak activity. Only clusters with more than 100 voxels are shown. The significance level was cut off at T-values lower than 8.0 (see heat map). Intensity threshold 1, (A) AU1+2, (B) AU4, (C) AU12, (D) AU24.

