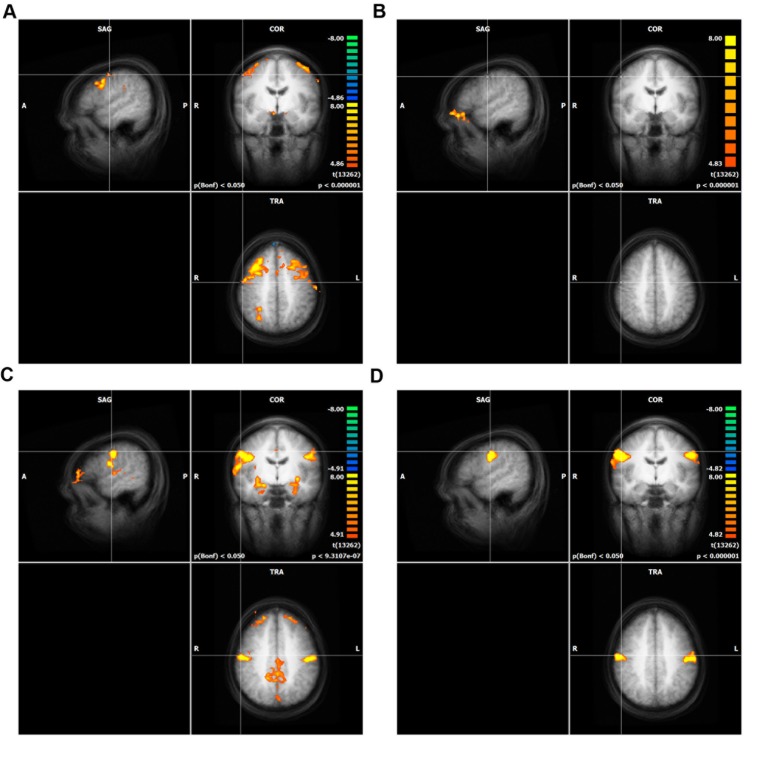
FIGURE 3.
Whole brain analysis of differential mapping, GLM in Conjunction with experimental condition against the baseline (including resting state). The crosshair in each of the four panels is located at the peak activity of direct mapping. Only clusters with more than 100 voxels are shown. The significance level was cut off at Bonferroni p = 0.05. Intensity threshold 1, (A) AU1+2, (B) AU4, (C) AU12, (D) AU24.

