
Figure 1.
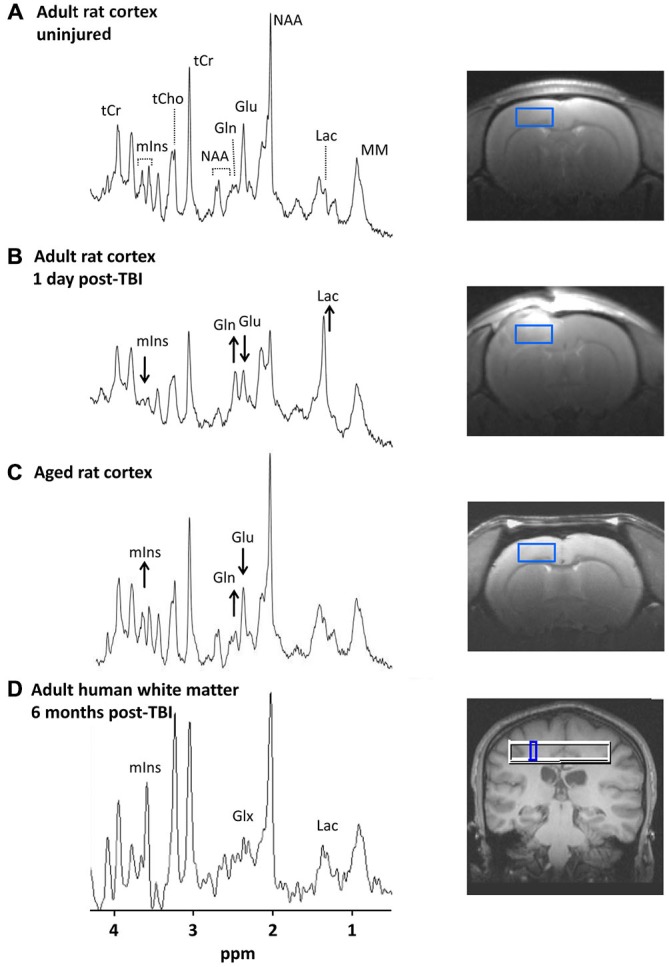
1H-magnetic resonance spectra in the injured and aging brain. (A–C) show spectra from rat cortex (2.7 × 1.3 × 2.7 mm3 ROI). Images to the right show the location of each ROI. (A) Spectrum from an un-injured adult male rat (3 months old). Major metabolite peaks visible at 9.4 T are labeled. (B) Spectrum from the same animal 1 day after a moderate severity controlled cortical impact TBI. Acute post-injury changes are visible including lower mIns and Glu and higher Gln and Lac. (C) Spectrum from an un-injured aged rat (22 months old). More subtle metabolic changes in the aging rat brain compared with younger controls include lower Glu and higher mIns and Gln. The complex resonance pattern of GSH is not immediately visible even at high magnetic field strengths but is detectable through digital signal processing. (D) Spectrum from human white matter (5 × 5 × 15 mm3 ROI) of an adult male (20 years old) at 6 months post-TBI. The mIns, Lac, and Glx peaks visible at 3 T are indicated. Human studies have reported elevated mIns and Glx in TBI survivors from sub-acute to chronic time points (~1 week to 6 months post-injury; Brooks et al., 2000; Ashwal et al., 2004a,b; Kierans et al., 2014). Abbreviations: ROI, region of interest; TBI, traumatic brain injury; mIns, myo-inositol; Glu, glutamate; Gln, glutamine; Lac, lactate, Glx, Glutamate + Glutamine; NAA, N = acetylaspartate; tCr, total creatine; tCho, total choline; MM, macromolecules. Figure reproduced in part from Harris et al. (2012) and Harris et al. (2014).