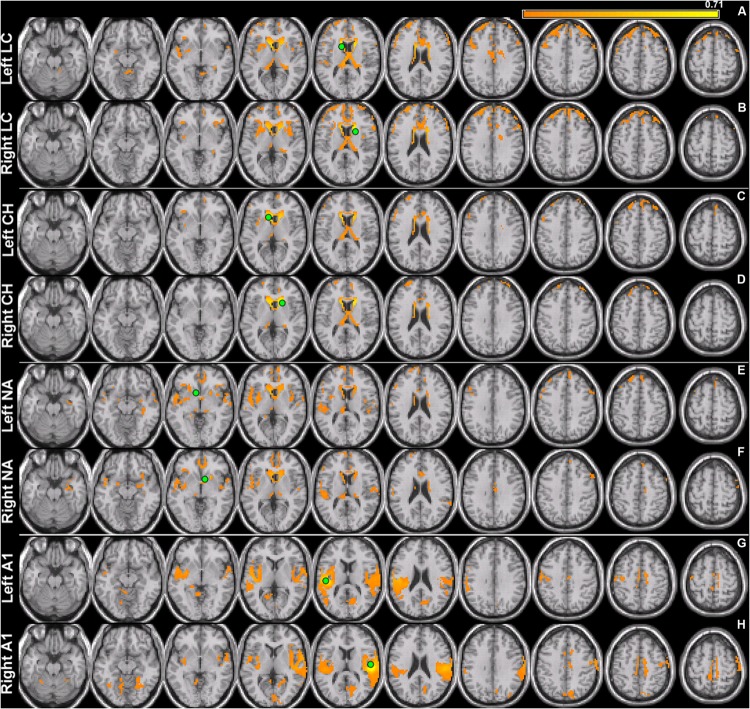
FIGURE 1.
Seed connectivity patterns in control subjects. Seeds (green) are placed in the left and right hemispheres of area LC (LC), caudate head (CH), nucleus accumbens (NA), and primary auditory cortex (A1). Within-subject group averages in the control cohort for the eight seeds that are used to identify resting-state networks show unique connectivity patterns (A–H) for each pair. Significant functionally connected voxels include those underneath the marked seed (green circle). All maps are thresholded (80% maximum coherence value) and superimposed on horizontal slices (left-to-right, z = –22, –12, –2, 5, 15, 25, 32, 42, 52, 62) of a template brain using MRICro (http://www.mccauslandcenter.sc.edu/mricro/).

