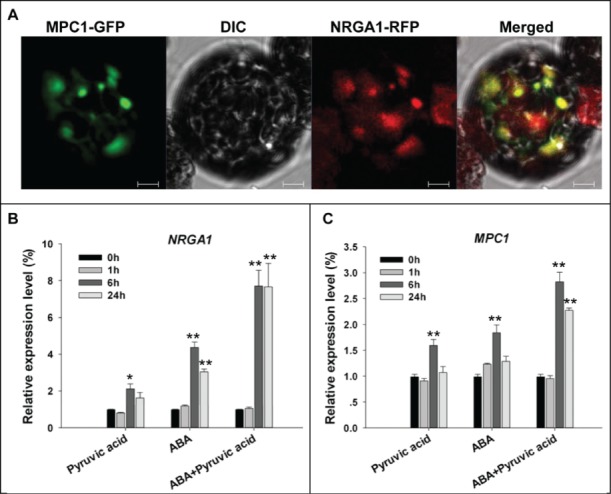
Figure 2.

Subcellular localization of MPC1 and its gene transcription behavior. (A) Colocalization of GFP-tagged MPC1 and RFP-tagged NRGA1. The yellow signal indicates areas of overlap between the green and red signals. Quantitative RT-PCR of NRGA1 (B) and MPC1 (C) transcript under 200 μM pyruvic acid, 100 μM ABA or both were analyzed. Transcript levels relative to that of ACTIN2 are presented for each treatment. Each value represents the mean±SE of 3 independent measurements. The *, ** represent significant difference determined by the Student's t-test at P < 0.05 and P < 0.01 respectively. Bars = 10 μm.
