
Figure 1.
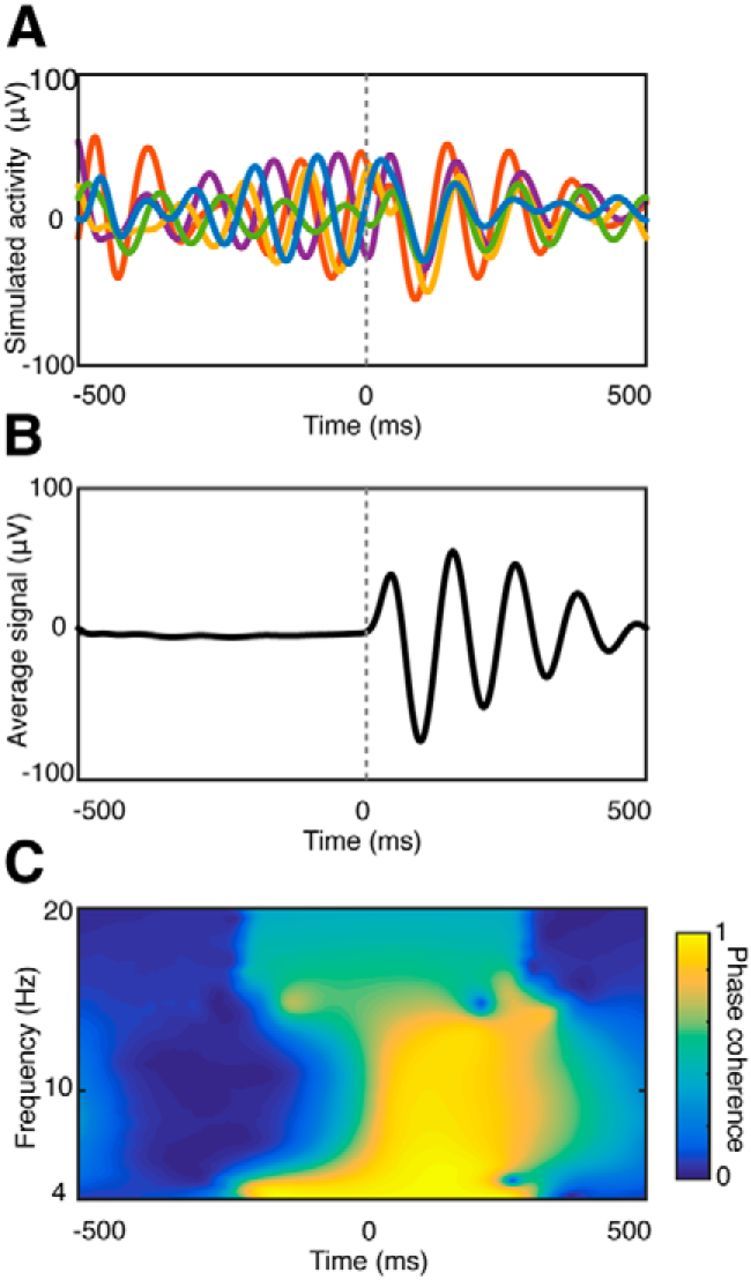
Schematic illustration of stimulus-induced phase reset. A, Phase reset of ongoing oscillations. The phases of five simulated oscillations (8–10 Hz) are reset at time 0. The group of simulated signals illustrates a set of hypothetical responses to stimulus presentation in a single brain region or from multiple brain regions. Note that the induced phase reset does not affect the amplitude or frequency of the ongoing oscillation. B, Average of 1000 simulated signals. The average amplitude is around zero before stimulus onset (time = 0 s), as the signals cancel out one another due to phase variability of the ongoing oscillations. Following stimulus onset and consequent phase reset, peaks and troughs in the individual signals across trials are aligned, resulting in increased average response amplitude. C, Time–frequency phase clustering plot of the 1000 simulated signals. Phase clustering was calculated by complex wavelet convolution of each signal and averaging the resulting phase angles at each time and frequency (Cohen, 2014). Phase clustering values can range from 0 to 1, with 0 (dark colors) corresponding to no phase relationship between the signals, and 1 (light colors) corresponding to perfect phase alignment. Note that phase clustering increases following the phase reset event at time = 0 s.