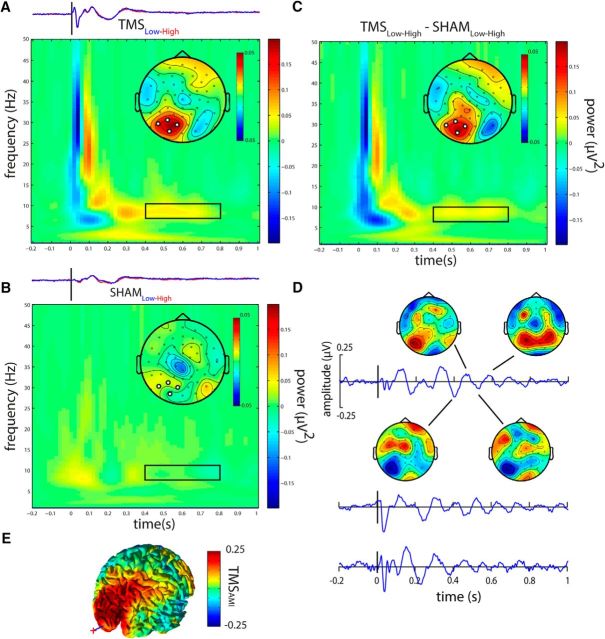
Figure 4.
Attention modulates TMS-locked alpha power. A, TFRs show the attentional modulation (Low − High visual attention) of TMS-locked oscillatory power for TMS. B, Sham (bottom row). Topographical maps represent the average power from the time-frequency region of interest (0.4–0.8 s after TMS, centered at 8 Hz, FFT window size: 375 ms) indicated by black rectangles within each TFR. The FFT window was multiplied with a Hanning taper, thereby biasing spectral estimation toward the center of the window. No overlap with pre-TMS intervals or with the removed TMS pulse occurred. The increased TMS-locked alpha power in the stimulated left visual cortex for TMS but not for Sham. For direct comparison with the TMS-locked power, TEPs separately for low (blue) and high (red) visual attention, are depicted above each TFR. C, The difference in attentional modulation (Low − High) between TMS and Sham: the interaction (TMSLow-High − ShamLow-High). D, TEPs for three representative subjects in the Low visual attention condition. Individual TMS-locked alpha oscillations are clearly visible but not perfectly phase-aligned across subjects, thus averaging out at the group TEP. Topographical voltage maps for several half-waves of the TMS-locked alpha oscillation demonstrate an oscillatory pattern mainly restricted to the stimulated left visual cortex. E, Source analysis of the normalized (TMSLow − High/TMSLow + High) attention modulation of TMS-locked alpha power demonstrates the modulation of TMS-locked alpha power by attention to be localized to the visual cortex in the stimulated left hemisphere. Red cross and blue line indicate position of the TMS coil and target, respectively.

