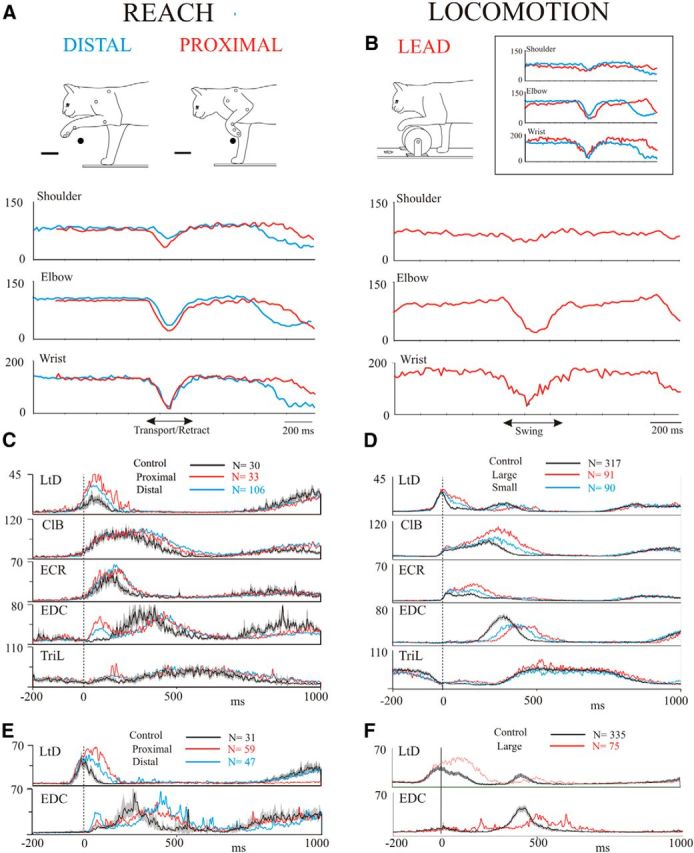
Figure 1.

Comparison of the kinematics and EMG activity during reach and locomotion. A, B, Example joint angles for cat MC28 for the two obstacle positions (distal and proximal) used during reach (A) and for a step over the large obstacle used during locomotion (B). The inset directly compares the angles during locomotion over the large obstacle and during the proximal reach. C, D, averaged EMG activity during reach and locomotion for cat MC28. E, F, Data from two muscles from cat MC29. Data in C–F are taken from selected days throughout the recording period of several months for each cat. In each trace, the interval of confidence (p = 0.01) for the unobstructed condition is shown as a gray shaded region around the average trace (black line). EMG data are expressed in arbitrary units, but are identical for reach and locomotion. Data are unfiltered and are synchronized to the onset of activity in the ClB. N indicates the number of trials included in each average for each condition.
