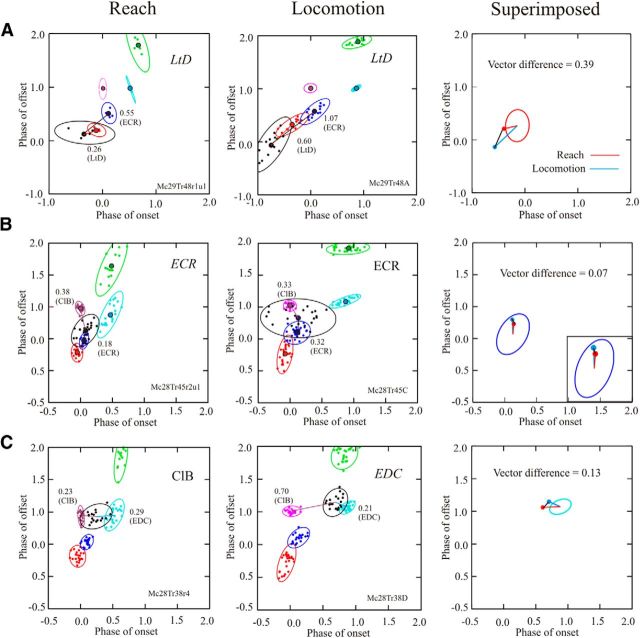
Figure 8.
A–C, Phase-space plots for three different cells during reach and locomotion. During reach (left column) and locomotion (middle column), we plot the activity of five representative muscles in the same manner as in Figure 3. The ellipses indicate the 90% confidence limits of the distribution of the data. We also illustrate the activity of a cell (black) recorded simultaneously with the EMG activity. Colored lines and associated numerical values indicate the EMG with which the cell showed the smallest Euclidean distance, together with the EMG showing the next smallest distance. The EMG with which the cell showed the best relationship is indicated at the top right of each plot and is in italics if the relationship was significant (see Materials and Methods). In the right column, we illustrate the vectors for reach (red lines) and locomotion (blue lines) superimposed on the mean ellipses (calculated from all trials in both MC28 and MC29) of the best-related EMGs. The Euclidean distance between the end points of the two vectors (black lines) is referred to as the vector difference. Note that in C, the cell was best related to a different muscle for reach and locomotion. The top two cells in this figure (A, B) are also the two cells illustrated at the top of Figures 4 and 6, and the third cell is the cell illustrated in Figures 4D and 6D.

