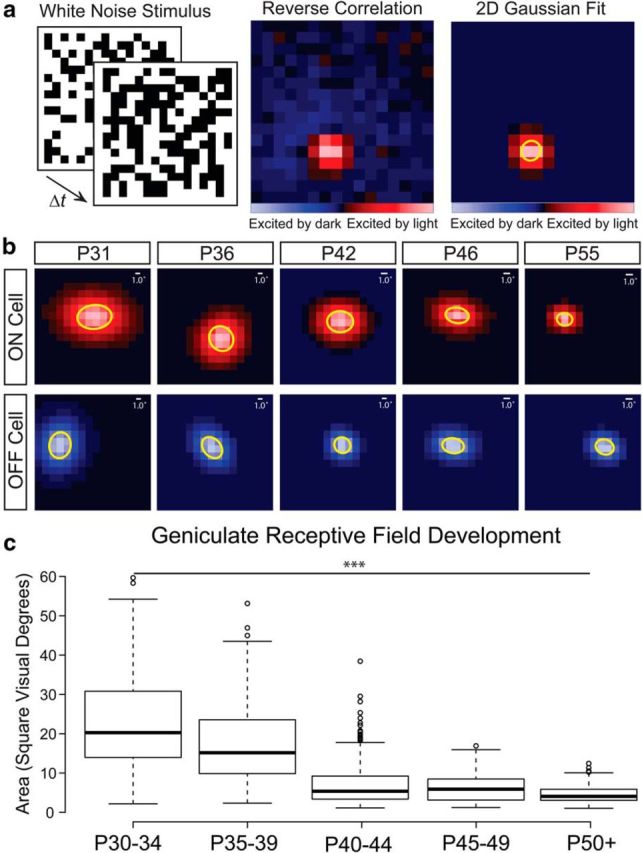
Figure 1.

Ferret geniculate receptive fields are refined over the first postnatal month after eye opening. a, Receptive fields of geniculate neurons in ferrets during the second postnatal month were measured by calculating the STA from the reverse correlation of a white noise stimulus. Red squares represent stimulus locations where the unit was excited by increasing luminance and the blue squares represent stimulus locations excited by decreasing luminance. The peak frame of the response was selected and a 2D Gaussian was fit to the receptive field center. The SD of the major and minor axis of the Gaussian was used to define the spatial area of the receptive field. b, Representative Gaussian fits of On and Off selective single unit receptive fields from control ferrets treated with intraocular saline injections from P15–P25. The 1SD ellipse is highlighted in yellow. Scale bars indicate the size of 1 visual degree relative to the size of each receptive field. c, Receptive fields become significantly smaller in the weeks after eye opening. Box-and-whisker plots are of all units recorded across all saline-treated ferrets grouped in 5 d windows after P30. Center lines show the medians; box limits indicate the 25th and 75th percentiles; whiskers extend 1.5 times the interquartile range from the 25th and 75th percentiles; and outliers are represented by dots (***p < 0.0001).
