Figure 3.
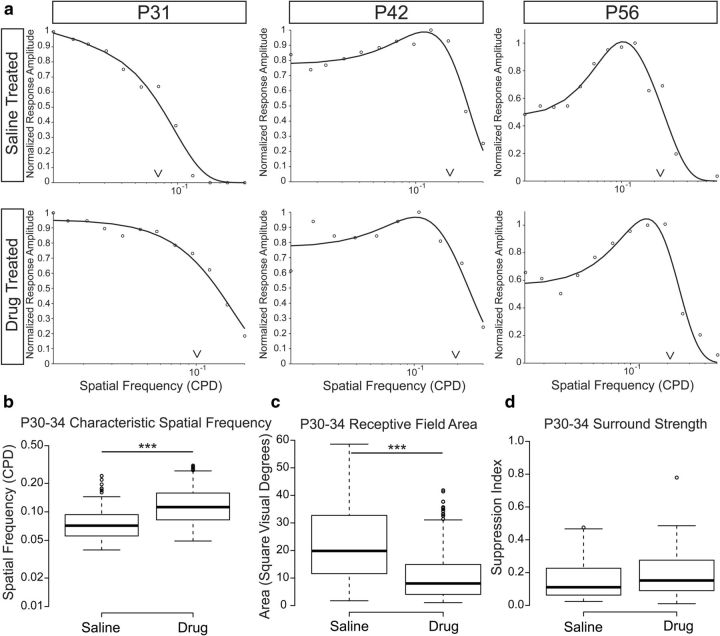
Characteristic spatial frequency, but not surround suppression, differs between saline-treated and drug-treated ferrets after eye opening. a, Representative spatial frequency-tuning curves from saline-treated (top) and either TGS- or CPPG-treated ferrets (drug-treated, bottom). Carets indicate the characteristic spatial frequency of the tuning curve as defined by the value where the response amplitude has fallen off to 1/e from the peak response. Tuning curves are more low-pass after eye opening, suggesting little surround suppression of responses to low spatial frequency stimuli. At older ages, tuning curves are more band-pass, indicating surround suppression of stimuli larger than the width of the receptive field center. b, Box-and-whisker plots showing a significant difference in the characteristic spatial frequency between saline-treated and drug-treated ferret receptive fields after eye opening. c, Receptive field areas calculated from the characteristic spatial frequency show a significant difference between saline- and drug-treated ferrets and closely resemble the estimates obtained from reverse correlations of the white noise stimulus. d, Few units show suppressive surrounds in either saline- or drug-treated ferrets after eye opening and the suppression that we observe is comparatively weak in both conditions, suggesting that receptive field differences are not due to differences in surround inhibition (***p < 0.001).

