Figure 5.
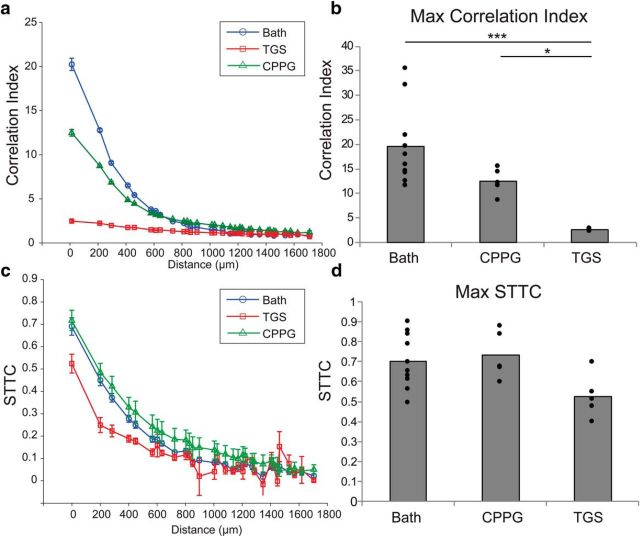
Correlations in the spontaneous activity of the retina persist after drug application. a, CI plotted as a function of interunit distance on the MEA for retinas recorded in bath solution (blue circles), TGS (red squares), or CPPG (green triangles). Data points are mean values for all units recorded from all retinas; error bars indicate SEM. CPPG application modestly reduces the CI and TGS application almost entirely abolishes the relationship between CI and distance on the MEA. b, Maximum CI was significantly reduced with both CPPG and TGS. Bars are the mean value of the maximum CI from across retinas; the filled circles are the maximum CI of each retina recorded. TGS application significantly reduces the max CI compared with both bath and CPPG application. c, STTCs are plotted the same as for the CI in a. STTC removes bias in estimating correlated activity during retinal waves due to differences in firing rate. CPPG does not reduce STTC from bath solution and TGS only modestly reduces STTC. d, There is no significant difference in the maximum STTC among bath, CPPG, and TGS across retinas, suggesting that the loss of correlation observed in the CI analysis is due to the higher spike rates (*p < 0.05, ***p < 0.001). For reference, 200 μm subtends ∼2.3° visual angle at the ages recorded.

