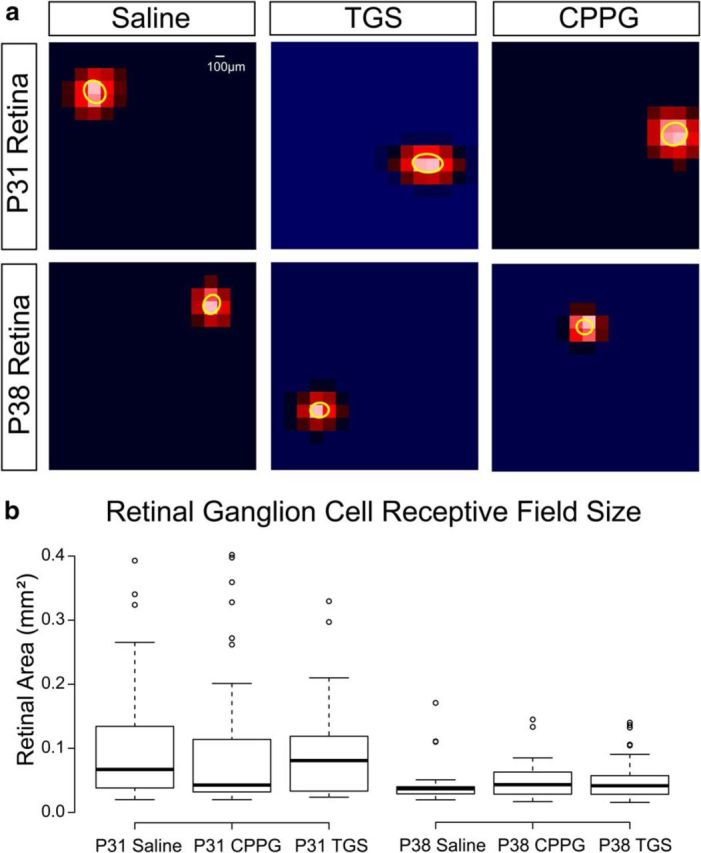
Figure 6.

RGC receptive field sizes do not differ after drug treatment. a, 2D Gaussian fits of representative ganglion cell receptive fields from MEA recordings during a white noise stimulus at P31 (top) and P38 (bottom) after ferrets were intraocularly injected with saline (left), TGS (center), or CPPG (right) from P15–P25. Scale bar, 100 μm (∼0.9° visual angle at the ages recorded). b, There is no difference in receptive field area across the treatment conditions at either P31 or P38, but there is a significant decrease in receptive field size between P31 and P38 across all conditions.
