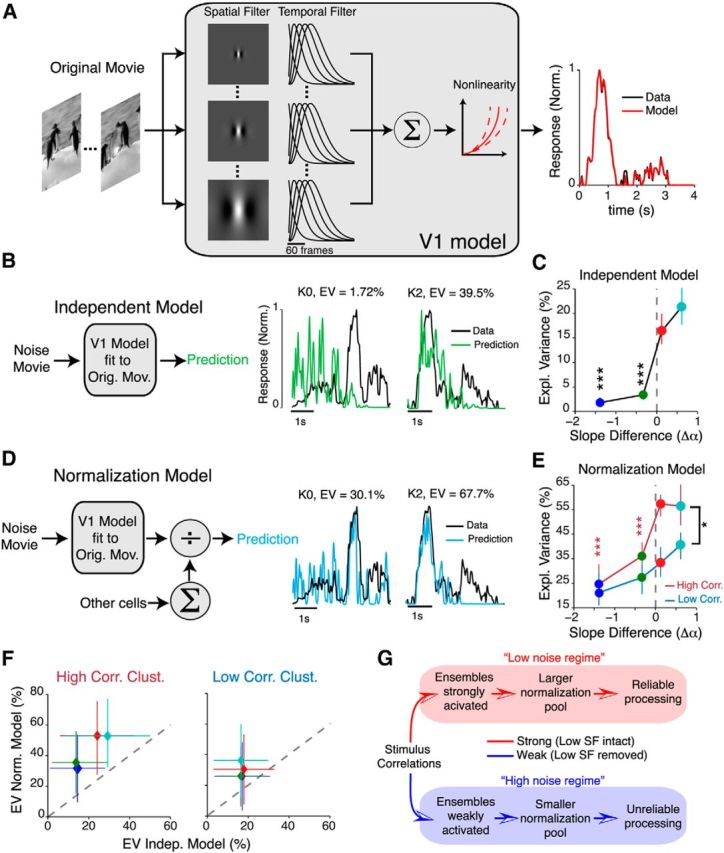
Figure 12.

Linear–nonlinear cascade model with normalization explains responses to correlated stimuli. A, Schematic of the model used to determine the best receptive field estimate from responses to an original movie. B, Left, Schematic describing independent model. This model assumes no interactions between neurons. Right, Representative examples showing the predicted output of this model (green) relative to the real data (black) from two cells. EV, Explained variance. C, Percentage variance explained by the independent model. D, Left, Schematic describing normalization model. This model assumes interactions between neurons via the divisive normalization rule. Right, Responses of the same cells as B, but predicted with the normalization model instead. E, Percentage variance explained by the normalization model for all stimulus conditions. Here, the high- (dark red) or low-correlation (dark blue) clusters were separately considered as normalization pools. Red stars indicate comparisons performed for data in the high-correlation cluster (relative to the K2 movie). Black stars indicate comparisons between high- and low-correlation clusters. Data in C and E are presented as the median ± 95% CI from 239 neurons. F, Scatter plot comparing performance, in terms of explained variance of the normalization model relative to the independent model for both high-SC and low-SC clusters. The EV of the independent model was computed from neurons in each cluster, whereas the EV of the normalization model was computed by applying the divisive normalization rule to all neurons in each cluster. G, Schematic summarizing the main findings of this study. In the low noise regime, strong stimulus spatial correlations dynamically alter interneuronal correlations to change the normalization pool, ensuring reliable processing. In the high noise regime, weak stimulus correlations fail to activate ensembles, resulting in unreliable processing. *p < 0.05; ***p < 10−4.
