Figure 2.

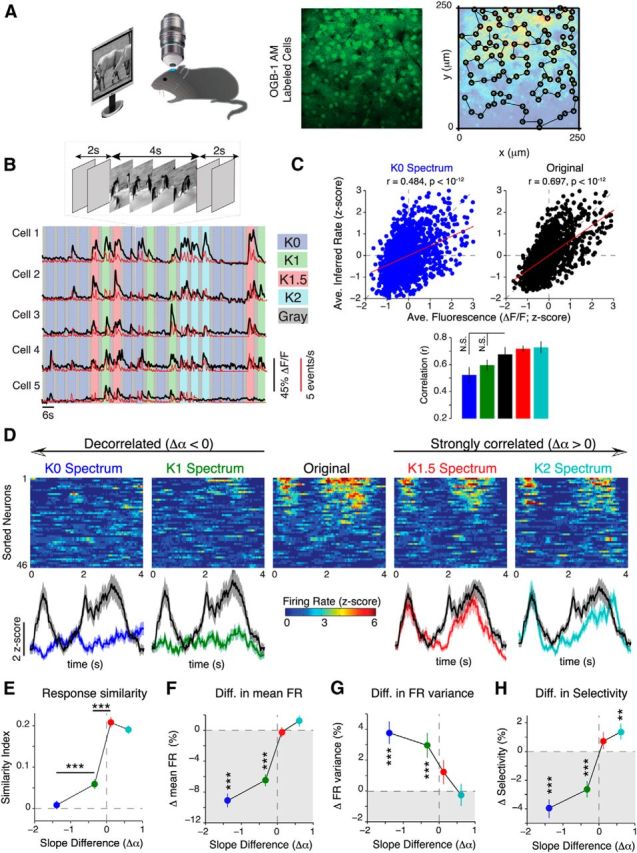
V1 neurons are sensitive to changes in spatial correlations. A, Left, Schematic of experimental setup. Middle, Representative neural population labeled with OGB1. Right, Neurons were detected with an automatic image segmentation algorithm and scanned with a custom line scan path (for details, see Materials and Methods). B, Top, Illustration of stimulus timing. Each movie was presented for 4 s and was flanked by 2 s gray screens. Bottom, Calcium transients (black) and deconvolved firing rates (red) from five representative neurons in response to a randomized sequence of stimuli. Each colored bar denotes the 4 s period over which a movie was presented. C, Top, Scatter plot showing the relationship between average fluorescence (ΔF/F) and inferred firing rate for both K0 spectrum (left) and original movies (right). The red lines show the linear least squares regression between ΔF/F and the inferred firing rate. Bottom, No significant difference in the Spearman's correlation between ΔF/F and the inferred firing rate between the different spectral conditions (p = 0.21, 1006 neurons from 16 mice). D, Top, Heat map showing trial-averaged firing rates (z-scored relative to spontaneous activity) from a population of 46 neurons. Neurons were sorted according to their mean response to the original movie. The same order was preserved in each heat map. Bottom, Population-averaged responses. The shaded area denotes SEM. E, Firing rate similarity index between neural responses to noise-masked movies and their original versions plotted as a function of the change in spectral slope. F–H, Percentage change in mean firing rate (FR; F), trial-to-trial FR variance (G), and selectivity (H) relative to the original movie. Data are presented as the median ± 95% confidence interval from 1006 neurons (16 mice). All p values in C and E–H were computed via Friedman's test followed by Bonferroni-corrected rank-sum tests. Colors are labeled in D. Error bars denote SEM. **p < 10−3; ***p < 10−4.
