Figure 3.
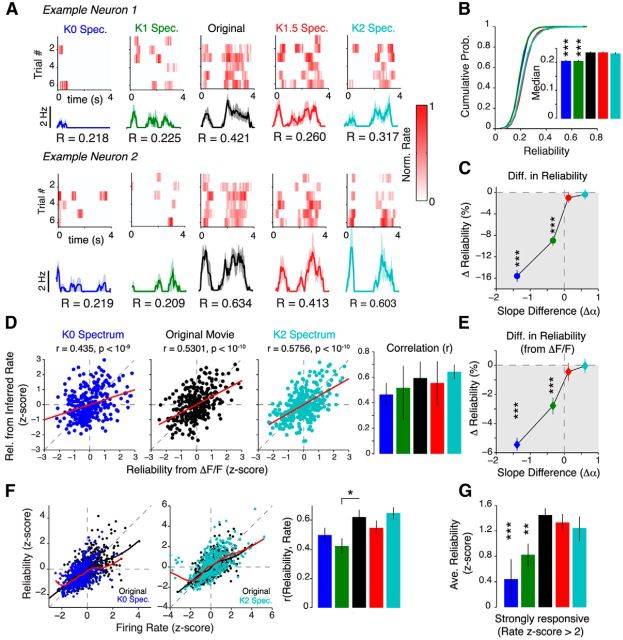
Spatially decorrelating natural movies decreases trial-to-trial reliability. A, Example raster plots from two neurons, where each row is the normalized response to a single presentation of a movie. The trial-averaged response is shown below together with the reliability (R) values. The shaded area indicates the SEM. B, Cumulative distribution of reliability values. The inset shows the median reliability value. C, Percentage change in reliability relative to the original movie. D, Left, Scatter plots showing the relationship between reliability calculated from calcium signals (ΔF/F) and reliability calculated from inferred firing rates for K0 spectrum movies, original movies, and K2 spectrum movies. The red line shows the linear least-squares regression. All examples show a strong linear relationship between the two reliability measures (p values computed using Student's t test). Right, No significant difference in the Spearman's correlation between reliability calculated from ΔF/F and reliability calculated from inferred firing rates for all spectral conditions. E, Same plot as in C, but using reliability was computed from ΔF/F instead. Measured calcium signals also show a monotonic decrease in reliability as spatial correlations are removed from natural movies. Data in B, C, and E are presented as the median ± 95% CI. F, Scatter plot showing the relationship between reliability and mean firing rate, illustrated for K0 (left) and K2 movies (middle). The thick black and red lines are the local regression (LOESS) lines for the original movie and the noise movien respectively. Right, Quantification of the Spearman rank correlation coefficient between response reliability and mean firing rate for all noise movie conditions. Only K1 movies had a significantly smaller correlation (p = 0.035, two-tailed rank-sum test; 650 neurons). G, Quantification of the reliability of strongly responding neurons. Strongly responding neurons were defined as neurons, which had a firing rate >2 SDs above the original movie (z score > 2σ). Reliability was also z-scored to pool data from different experiments. Data in B–F were obtained from 650 neurons (16 mice). The p values were computed using Bonferroni-corrected two-tailed rank-sum tests relative to the original movie. Error bars denote SEM. *p < 0.05; **p < 10−3; ***p < 10−4.

