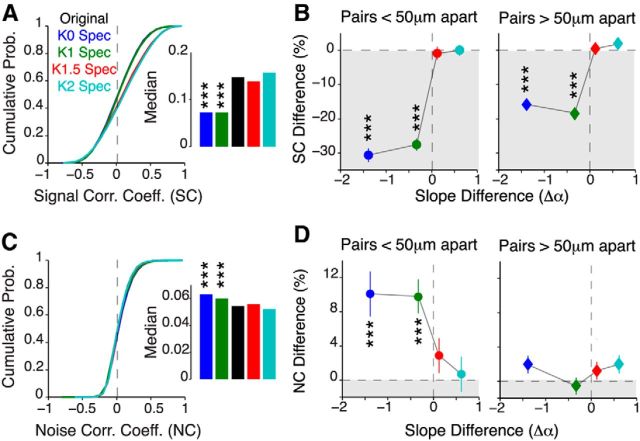
Figure 7.
Bidirectional modulation of interneuronal correlations. A, Cumulative distribution of SCs for all spectral conditions. The inset shows the median SC. B, Pairwise difference in signal correlation as a function of spectral slope difference for neuron pairs <50 μm apart (left) and >50 μm apart (right). C, D, Same as A and B, but for NCs. All data are presented as the median ± 95% CI from 16 mice (650 neurons; 210,925 neuronal pairs). All p values were computed using a Friedman test followed by post hoc Bonferroni-corrected rank-sum test relative to the original movie. ***p < 10−4.

