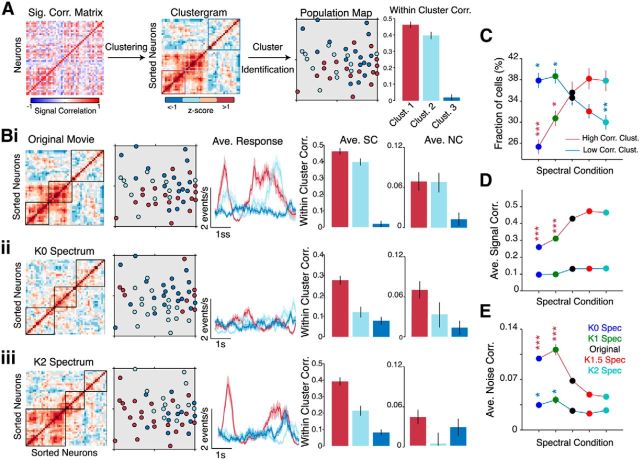
Figure 9.
Clustering analysis reveals distinct ensembles of highly correlated neurons. A, Illustration of the clustering method used to group neurons based on their SC coefficients. The histogram shows average SC within each cluster. Error bars denote SEM. Bi–Biii, Clustering analysis applied to the same neural population in response to an original movie (Bi) and its K0 spectrum (Bii) and K2 spectrum versions (Biii). The color-coded population maps show a reorganization of the clusters to the different stimuli. The size of the population map is 250 × 250 μm. Subsequent panels show the average response of neurons in each cluster and a quantification of within-cluster signal and noise correlation coefficients. Error bars and shaded areas denote SEM across neurons in each cluster. C, Fraction of neurons in the high- (dark red) and low-correlation (dark blue) clusters for all stimulus conditions. D, E, Average signal correlation (D) and noise correlation (E) between neurons in each cluster. All data in D and E are presented as mean ± SEM from 16 mice. The p values were computed relative to the original movie using a post hoc Bonferroni-corrected rank-sum test. Colors of symbols indicate the correlation cluster. *p < 0.05; **p < 10−3; ***p < 10−4.

