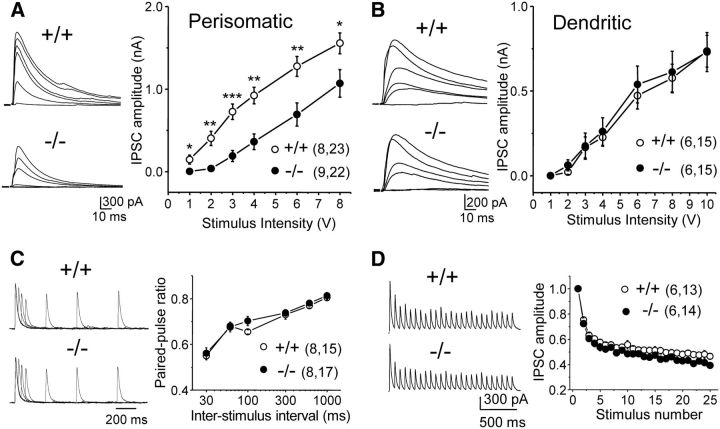
Figure 3.
Inhibition is altered in CA1 area of Cntnap2−/− mice. A, B, Input/output curve (right) and representative traces (left; 20 averaged responses in each trace) of perisomatic (A) and dendritic (B) IPSCs evoked in CA1 pyramidal cells by electrical stimulation in st. pyramidale or st. radiatum, respectively. The amplitude of perisomatic IPSCs was significantly reduced (*p < 0.05; **p < 0.01; ***p < 0.001) in the knock-out (−/−) compared with wild-type (+/+) littermates. C, Paired-pulse ratio of perisomatic IPSCs at various interstimulus intervals (left, representative traces; right, summary plot) showed no differences between genotypes. D, Perisomatic IPSCs evoked by a 25 stimuli, 14 Hz train (left, representative traces; right, summary plot) also showed no difference between genotypes.

