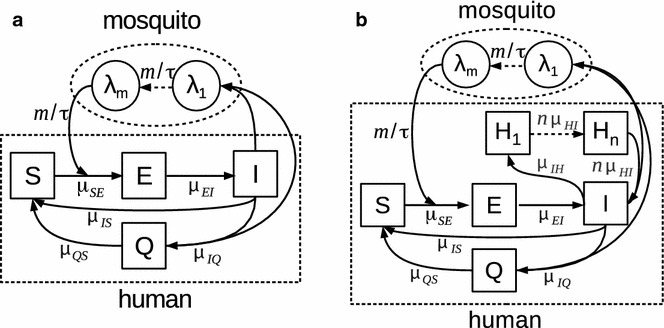
Fig. 2.

Malaria transmission models. a, b Model diagram for the population dynamics of falciparum and vivax malaria are respectively shown. Compartments for the human population are represented as squares, and those related to the force-of-infection via the mosquito vector (classes λ 1…m for m = 2) are represented as circles, with arrows indicating the direction of transition between classes. The per-capita rate of transition is included next to each arrow (see Additional file 3 for model equations and description)
