
Figure 9.
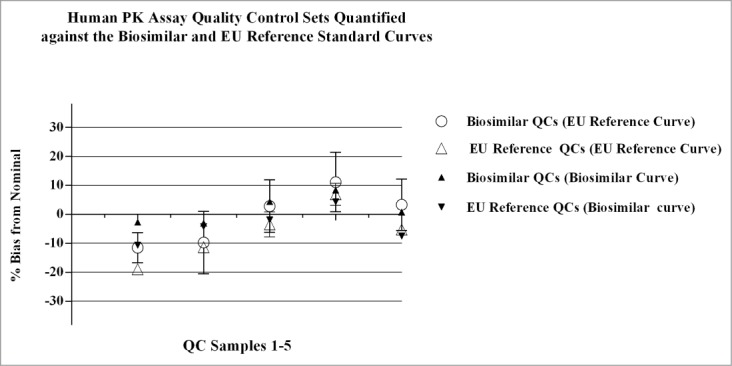
Parallel standard curves and QC sample sets were analyzed on the same plate during qualification of the human PK assay. The biosimilar vs. FDA reference product were analyzed in parallel on individual plates, and the biosimilar vs. the EU reference product were analyzed on separate plates. The QC samples were cross-quantified against the different standard curves and the %bias was calculated as: [(observed-nominal (ng/mL))/ nominal (ng/mL))] x 100. Data presented in Figure 9 are QC values from one plate in the qualification study comparing the EU reference product to the biosimilar product; similar results were obtained across the additional runs for the EU reference product and runs comparing the FDA reference product to the biosimilar product. Results obtained for QCs quantitated from the different standard curves were comparable, with bias values within ± 20% of nominal. Concentration of QC samples 1–5 (left to right): 50, 150, 1250, 9600, and 12800ng/mL, respectively.