Figure 1.
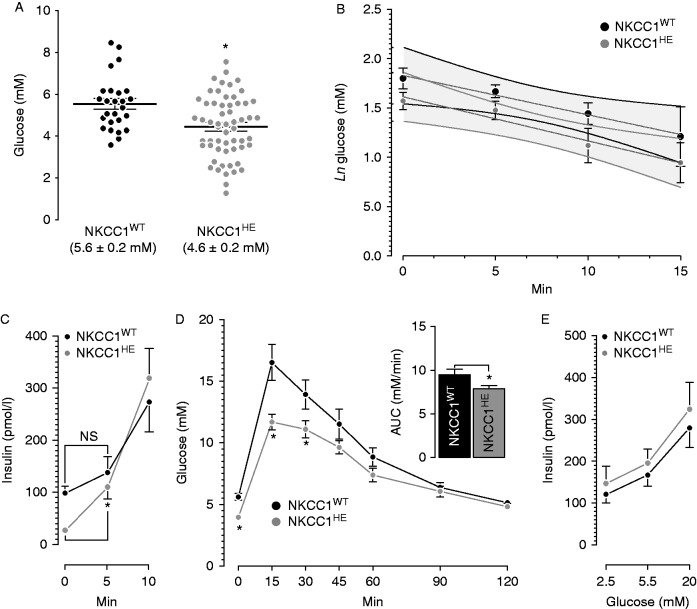
Basal glycemia, glucose disposal, plasma insulin and insulin responses in vitro and in vivo in NKCC1HE mice. (A) Blood glucose levels in fasted NKCC1WT (black dots, n=26) and NKCC1HE mice (grey dots, n=58). Values are stated for each genotype and expressed as the means±s.e.m. (*P=0.003). (B) Insulin-induced hypoglycemia in fasted NKCC1WT (black dots, n=5) and NKCC1HE mice (grey dots, n=6). Results are plotted as natural logarithms of initial blood glucose, i.e., before insulin injection vs time in minutes. The differences between the slopes of each curve (grey lines), calculated by linear regression analysis, were not statistically different (P=0.816). The 95% confidence limits are indicated as overlapped shaded areas. (C) Basal and glucose-stimulated plasma insulin in fasted NKCC1WT (black dots, n=3–7) and NKCC1HE mice (grey dots, n=7–12). Plasma insulin levels either basal or 5 min post-glucose stimuli were not different (NS) in NKCC1WT (basal: 107.1±5.2 pmol/l, 5 min: 137.7±30.9 pmol/l, P=0.443) but were in NKCC1HE mice (basal: 25.8±2.4 pmol/l, 5 min: 109.8±21.9 pmol/l, *P=0.010). (D) Intra-peritoneal glucose tolerance tests in NKCC1WT (black dots, n=7) and NKCC1HE mice (grey dots, n=10). Basal blood glucose in NKCC1WT and NKCC1HE mice is 5.6±0.3 and 4.0±0.3 mM respectively (*P=0.001). Glycemia 15 and 30 min post-glucose stimulus was significantly lower in NKCC1HE mice relative to NKCC1WT (*P<0.05). Inset: areas under each GTT curve (NKCC1WT=9.5±0.6 mM/min, NKCC1HE=7.9±0.4, *P=0.027). (E) Insulin secretion from equivalent numbers of NKCC1WT and NKCC1HE islets (black and grey dots, respectively) challenged with the indicated glucose concentrations. Results are expressed as mean insulin (pmol/l)±s.e.m. present in the culture media (n=5).

 This work is licensed under a