Figure 2.

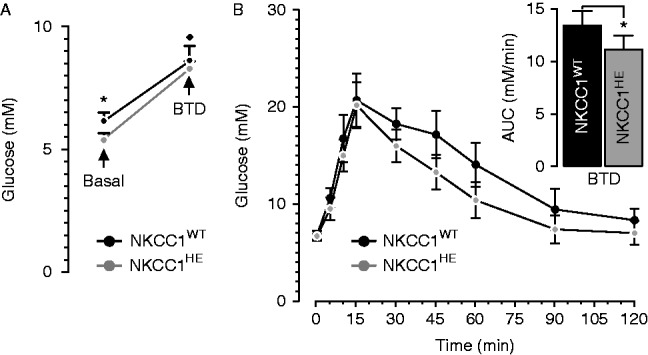
Effect of BTD on fasting blood glucose and glucose clearance in NKCC1HE mice. (A) Glucose levels were determined in two groups (n=10 each) of fasted NKCC1WT and NKCC1HE mice (black and grey dots respectively) before (basal, *P=0.035) and 5 min after i.p. injection of 50 mg/kg of BTD (*P<0.05 relative to basal). (B) Intra-peritoneal glucose tolerance tests performed in fasted NKCC1WT and NKCC1HE mice (filled and shaded dots respectively) 5 min after BTD injection (50 mg/kg). Inset: AUC of each GTT curve (*P=0.010).

 This work is licensed under a