Figure 4.
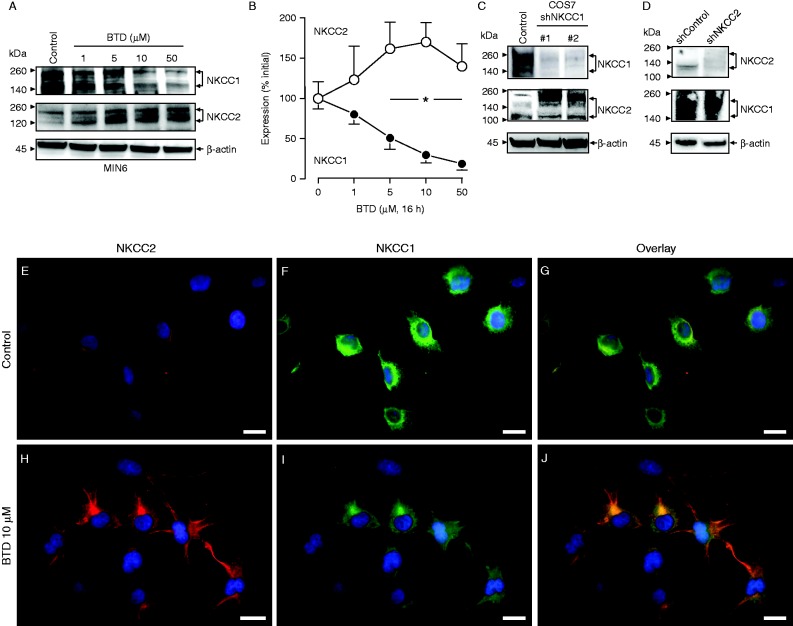
Expression relationship between NKCC1 and NKCC2 in β-cells. (A) Representative immunoblot of protein extracts obtained from MIN6 (Control and treated with the indicated concentrations BTD 16 h probed against NKCC1, NKCC2 or β-actin (internal loading control)). (B) Densitometry analysis of at least three independent experiments. Results are expressed as percentage change in densitometry intensity (arbitrary units relative to initial values (*P<0.05)). (C and D) Representative western blots of COS7 cells (Control) and stably depleted of NKCC1 (shNKCC1) (C) or COS7 Control and depleted of NKCC2 (shNKCC2) (D) probed against NKCC1 and NKCC2. Note that the NKCC2 blot in C has been overexposed to visualize NKCC2 in COS7 control. (E, F, G, H, I and J) Representative immunofluorescence microscopy images of COS7 cells cultured in the absence (Control, E, F and G) or in the presence of BTD for 16 h (BTD 10 μM, H, I and J). Co-expression of immunoreactive NKCC2 and NKCC1 was developed by using fluorescently labeled secondary antibodies: Cy3 (NKCC2, red) and AF488 (NKCC1, green). The cell nuclei were counterstained using DAPI. Scale bars represent 10 μm.

 This work is licensed under a